


Introduction
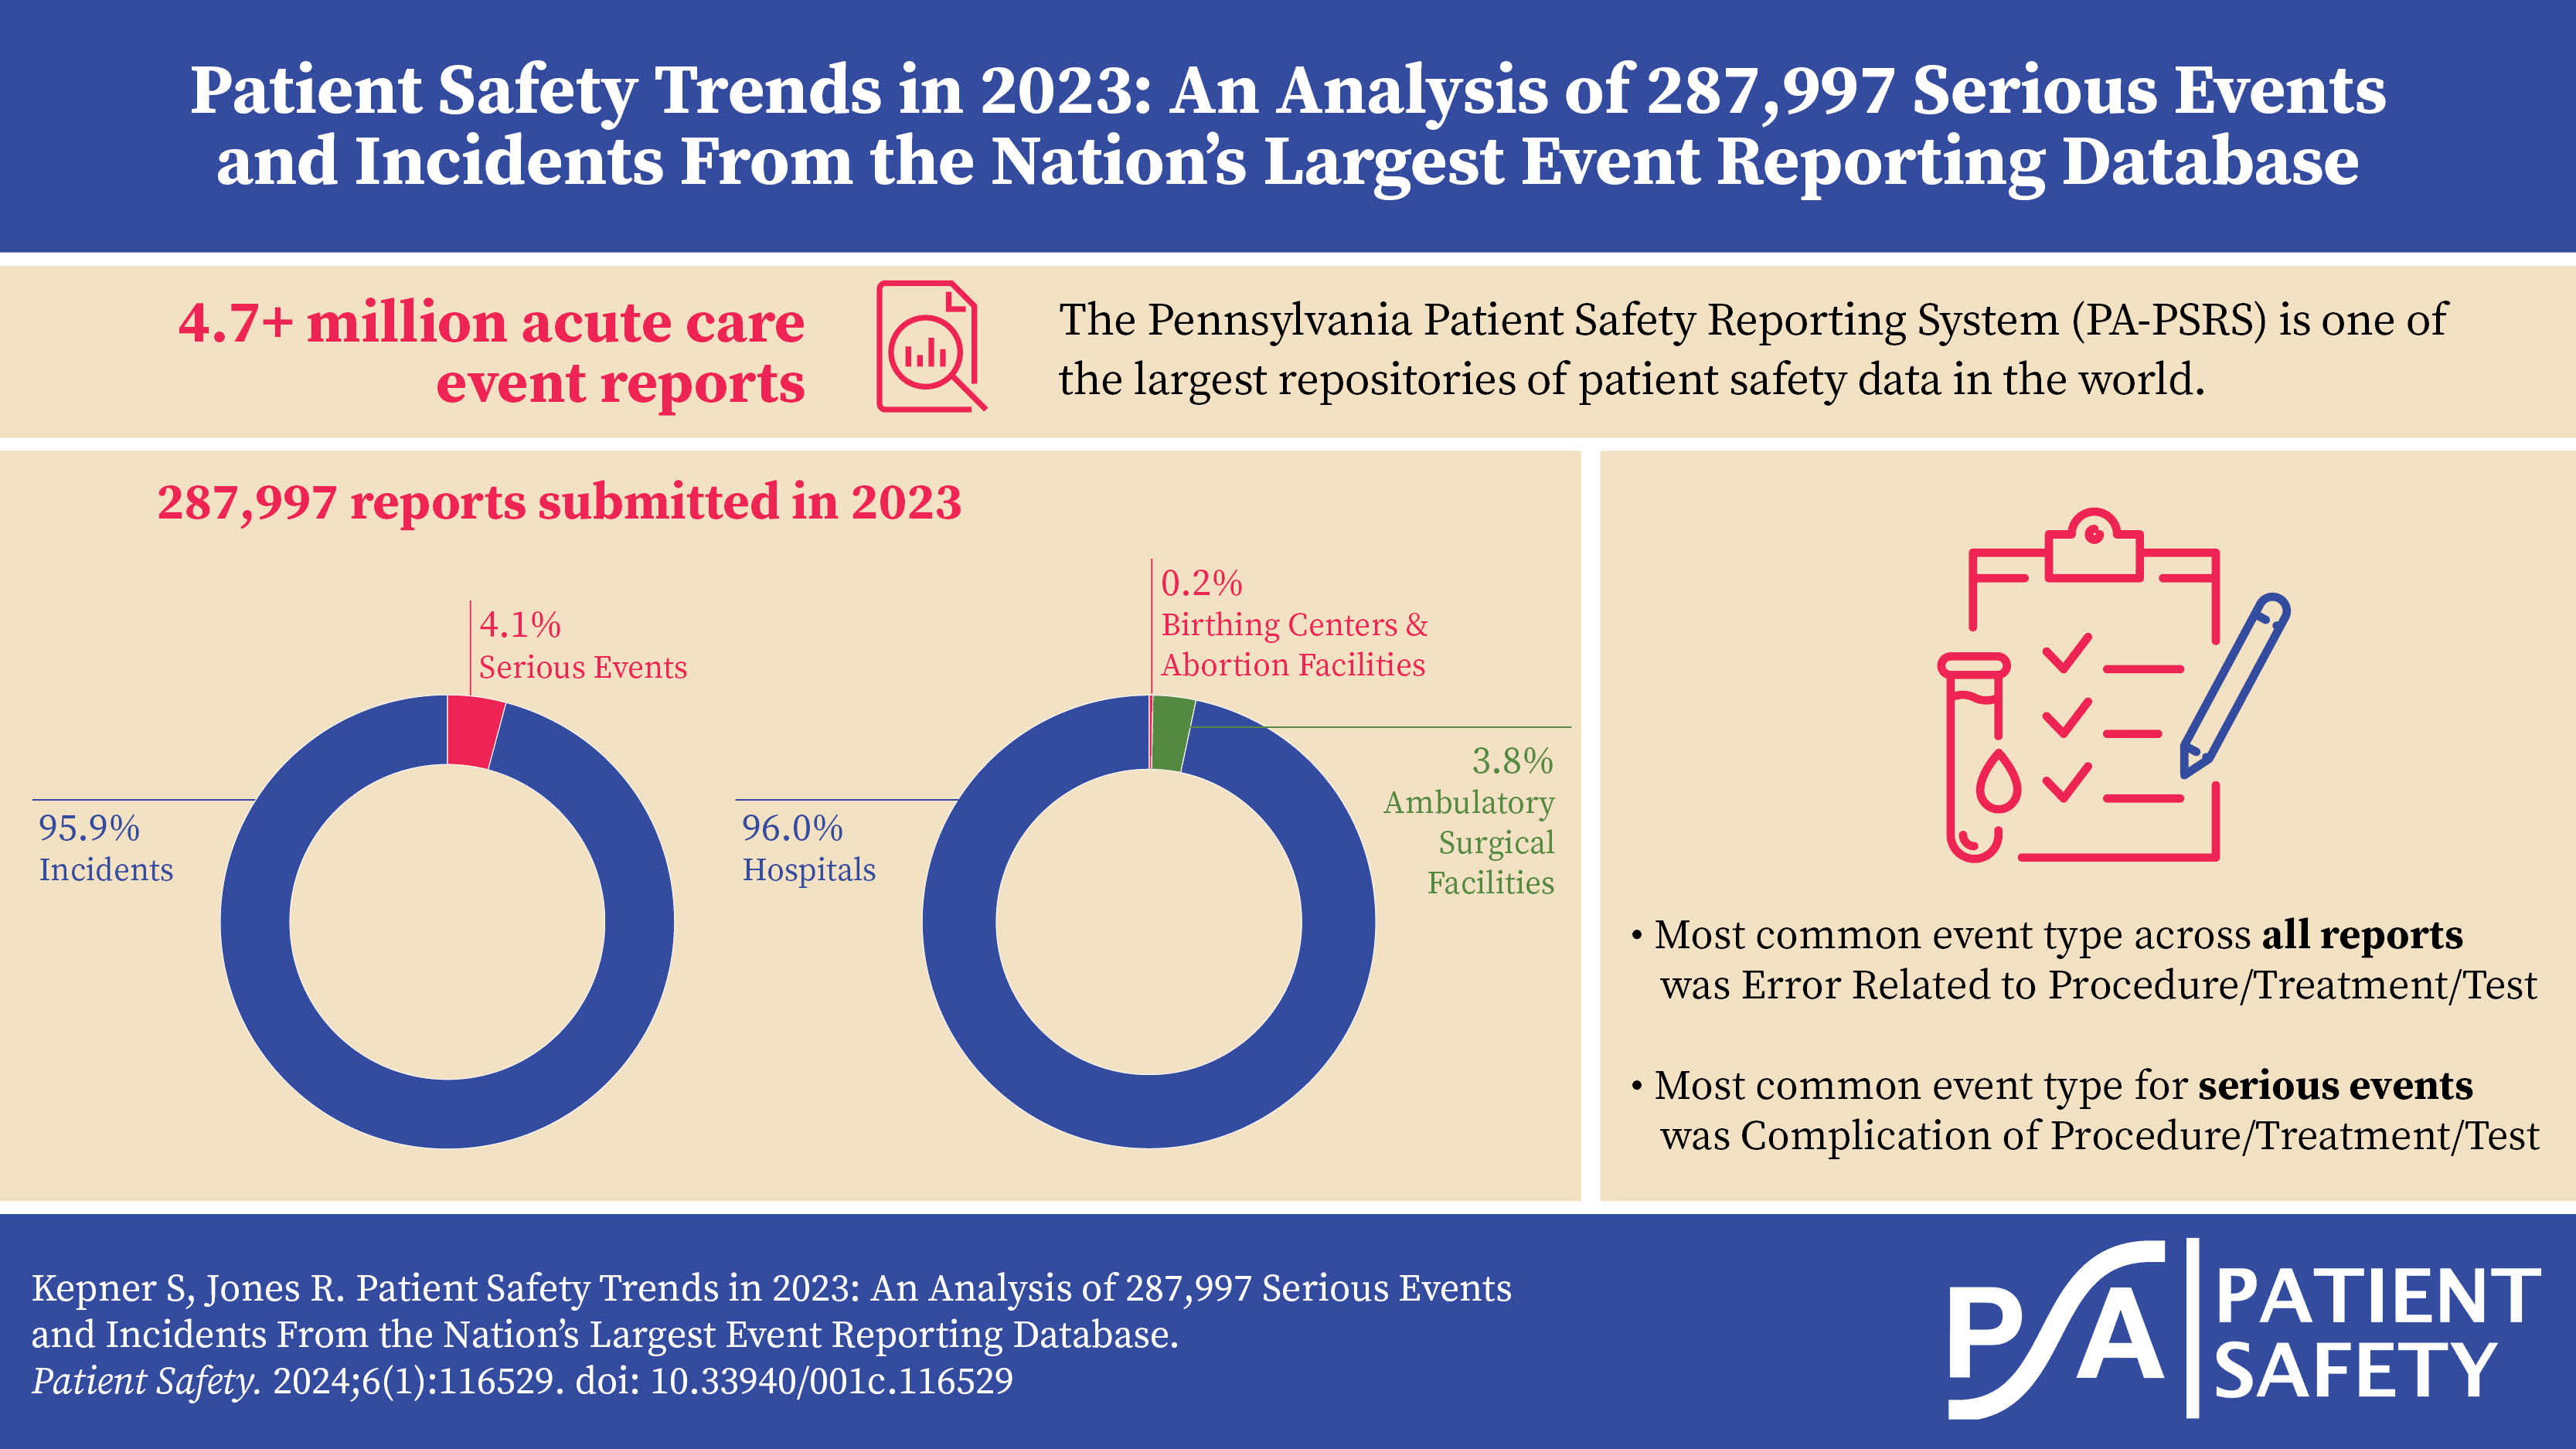
Pennsylvania is the only state that requires healthcare facilities to report all events that cause harm or have the potential to cause harm to a patient. These patient safety events are reported to the Pennsylvania Patient Safety Reporting System (PA-PSRS)[1], which is the largest repository of patient safety data in the United States and one of the largest in the world, with over 4.7 million acute care event reports dating back to 2004.
This article summarizes data from acute care event reports submitted to PA-PSRS in 2023, along with comparisons and insights that can be used to identify potential areas of focus for patient safety efforts.
Definitions
Terms describing patient safety occurrences, including “serious event,” “medical error,” “adverse event,” “harm,” and “incident,” are often used interchangeably. However, within the context of this manuscript they have distinct meanings and indications for whether they must be reported to PA-PSRS in accordance with the Medical Care Availability and Reduction of Error (MCARE) Act (Act 13 of 2002).1 An “incident” is defined as “an event, occurrence, or situation involving the clinical care of a patient in a medical facility which could have injured the patient but did not either cause an unanticipated injury or require the delivery of additional healthcare services to the patient.”1 A “serious event” is defined as “an event, occurrence, or situation involving the clinical care of a patient in a medical facility that results in death or compromises patient safety and results in an unanticipated injury requiring the delivery of additional healthcare services to the patient.”1
Each event report includes a harm score—assigned by the reporting facility—that describes the potential or actual harm to the patient resulting from the event. Table 1 lists the definition for each harm score, along with harm score groupings for incidents, serious events, and high harm events.

Methods
This analysis was performed using data extracted from PA-PSRS on February 1, 2024, and data from the Pennsylvania Health Care Cost Containment Council (PHC4)[2]. Report counts are based on the date the report was submitted; reporting rates are based on the event occurrence date and calculated per 1,000 patient days for hospitals and per 1,000 surgical encounters for ASFs. Event occurrence date is used for rate calculations to ensure consistency with the time frame in which the patient days or surgical encounters occurred. At the time this analysis was performed, data from PHC4 was available through Q2 2023, which allowed us to calculate 2023 rates using the first two quarters of PA-PSRS data.
Results
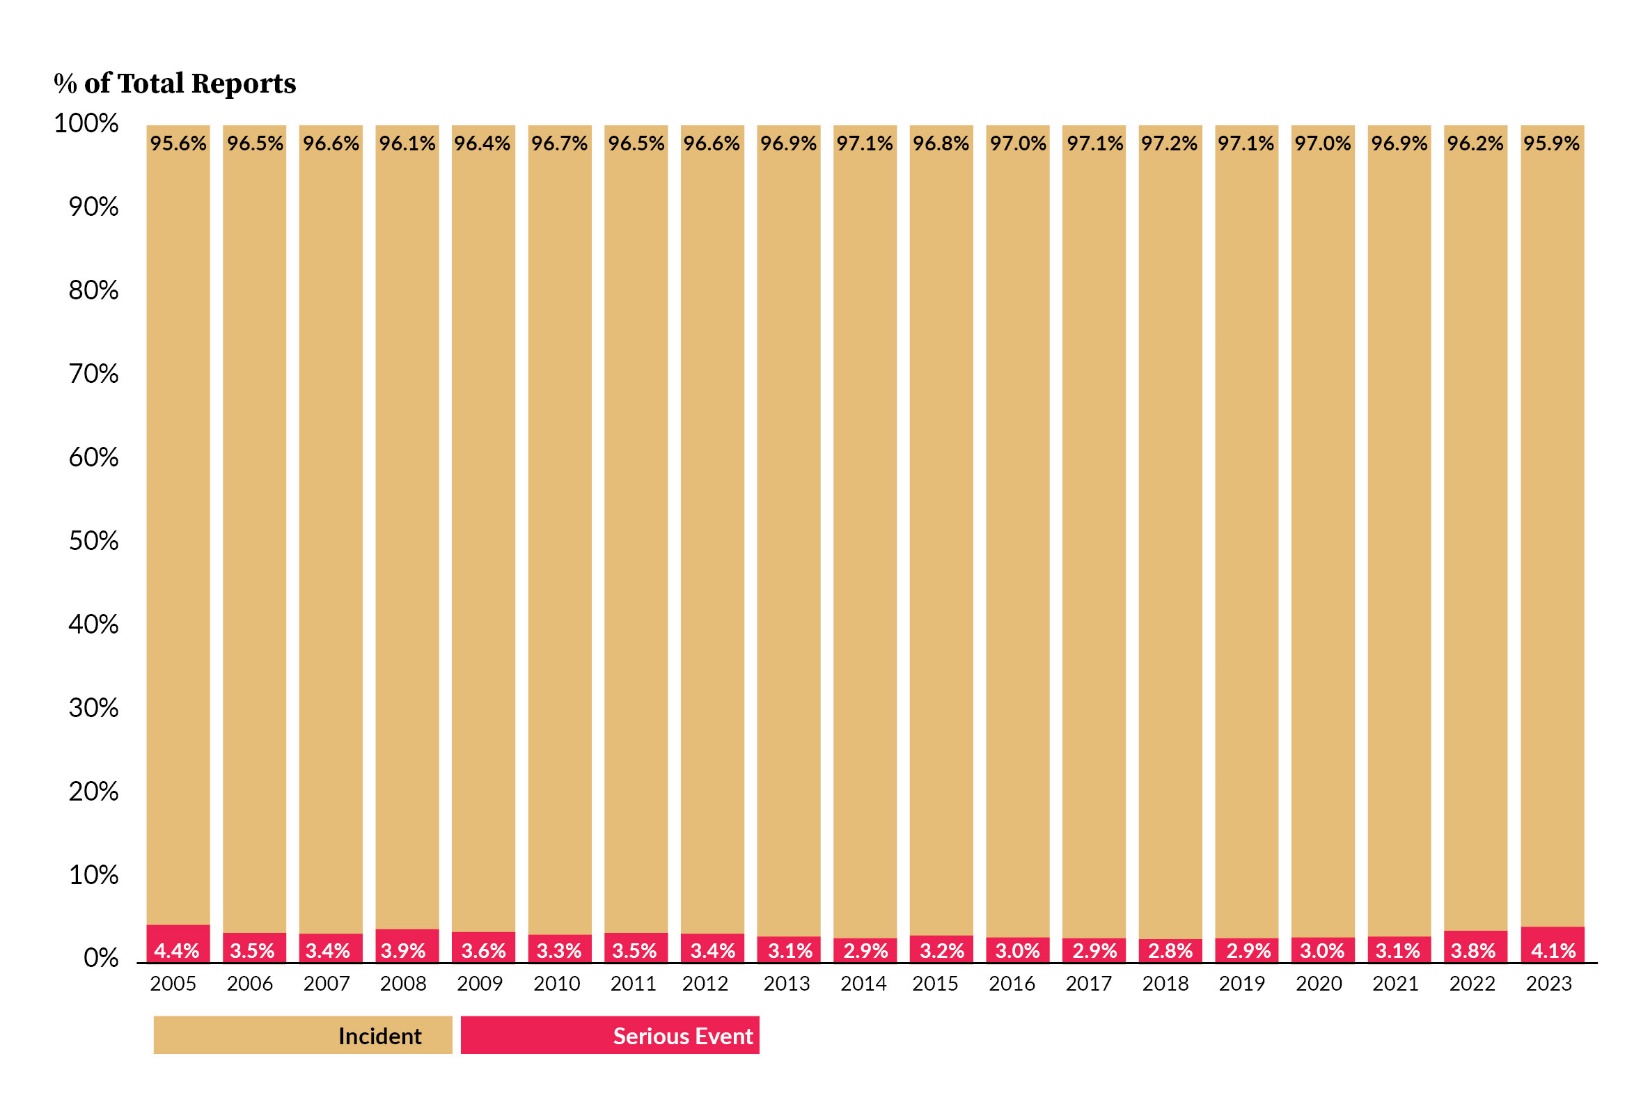
As seen in Figure 1, a total of 287,997 reports were submitted by Pennsylvania acute care facilities in 2023, which represents a 12.2% increase (31,324 reports) over the prior year, the largest percentage increase since 2006. Of the 287,997 reports submitted in 2023, 11,750 were serious events, and of those serious events, 610 were classified as high harm. The numbers of serious and high harm events increased from 2022 by 20.6% and 25.0%, respectively, which are the largest annual percentage increases for both categories historically. Figure 2 shows incidents and serious events as a percentage of total reports. In 2023, 4.1% of reports were serious events, which represents the highest percentage since the first full year of PA-PSRS reporting in 2005.


More than half (52.9%; 301 of 569) of the acute care facilities increased their number of report submissions in 2023, with an average increase of 144 reports and median increase of 18 reports. The five facilities with the largest increase in number of reports accounted for 37.0% (11,595 of 31,324) of the total increase in 2023. Nearly two-thirds (64.8%; 7,509 of 11,595) of reports from those five facilities were in the Error Related to Procedure/Treatment/Test (P/T/T) and Medication Error event types.
About half (48.9%; 278 of 569) of the acute care facilities increased their reporting of serious events, with an average increase of 11 reports and median increase of 4 reports. The five facilities with the largest increase in number of serious events collectively submitted 684 more serious event reports in 2023 than in 2022. More than half (56.1%; 384 of 684) of the increase in serious event reports was in the Complication of P/T/T event type, and the majority (53.6%; 206 of 384) of those reports were in the Complication following surgery or invasive procedure event subtype.
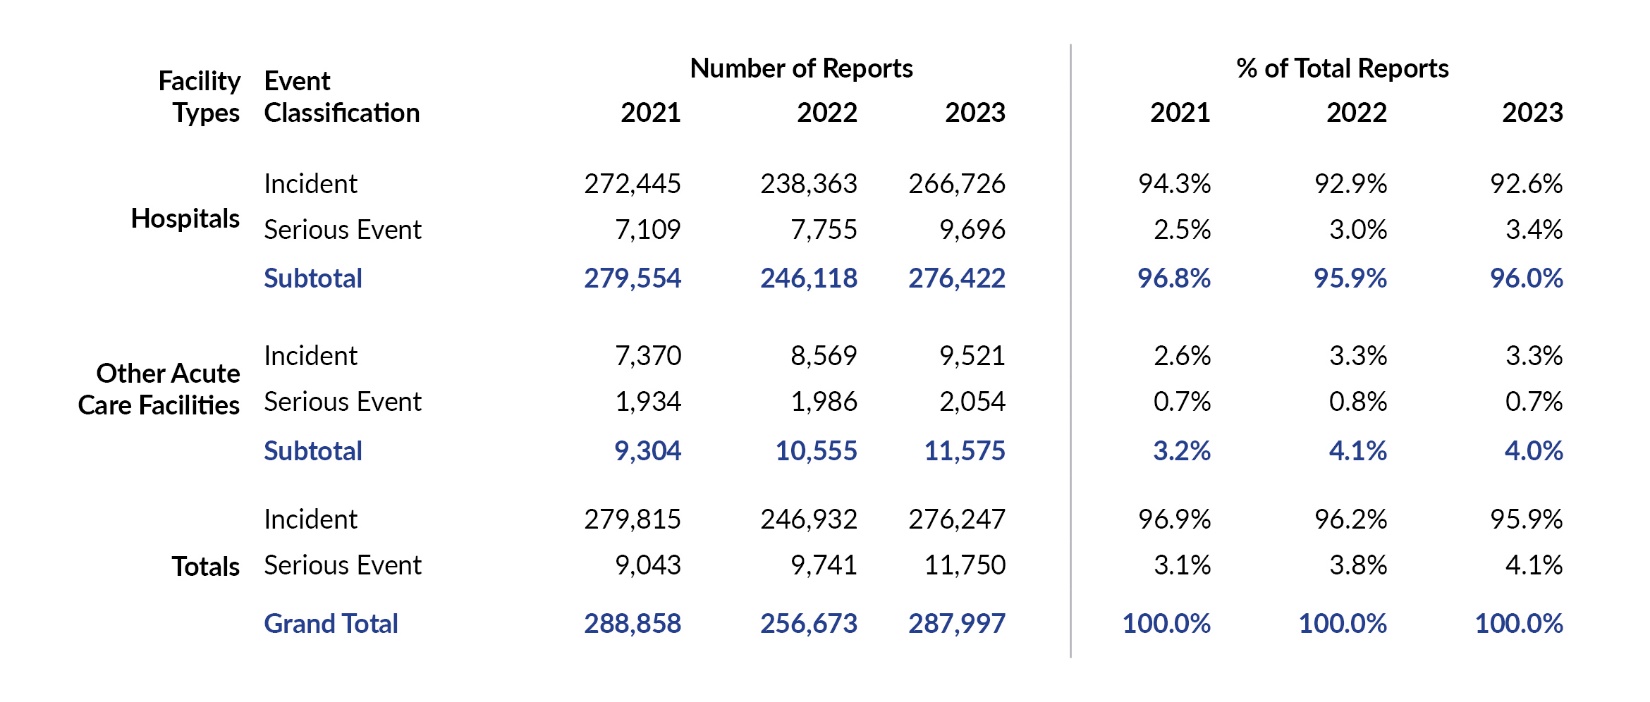
Table 2 shows a breakdown of incidents and serious events by facility type from the past three years. From 2022 to 2023, the number of reports submitted by hospitals increased by 30,304 (12.3%), and reports from other acute care facilities (ASFs, birthing centers [BRCs], and abortion facilities [ABFs]) increased by 1,020 (9.7%).

The harm score distributions for reports submitted during years 2021–2023 are shown in Table 3. Consistently, the most frequent harm score is C (41.2% of total reports in 2023), and harm score C had the largest growth, increasing by 13,647 reports in 2023. Serious events comprised 4.1% of total reports submitted in 2023, with harm scores E and F being reported most frequently. The largest percentage increase was with harm score G, which increased by 83.0%, going from 53 reports in 2022 to 97 in 2023.

Reporting Rates Based on Event Occurrence Date
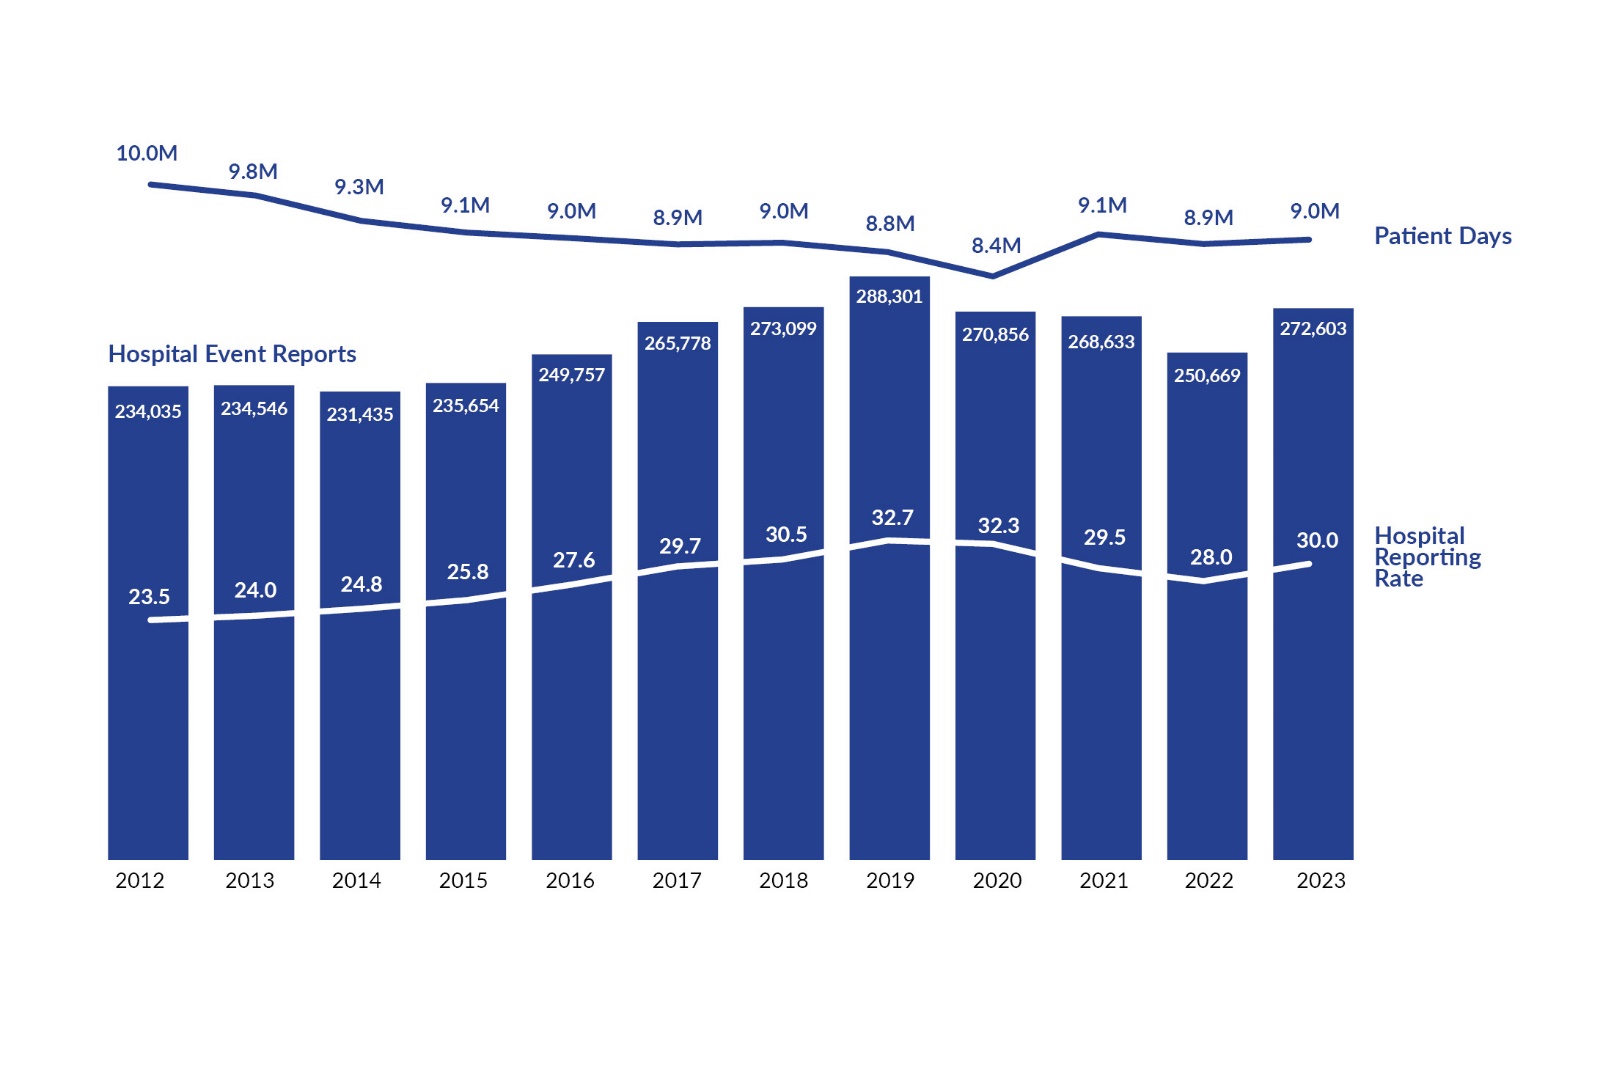
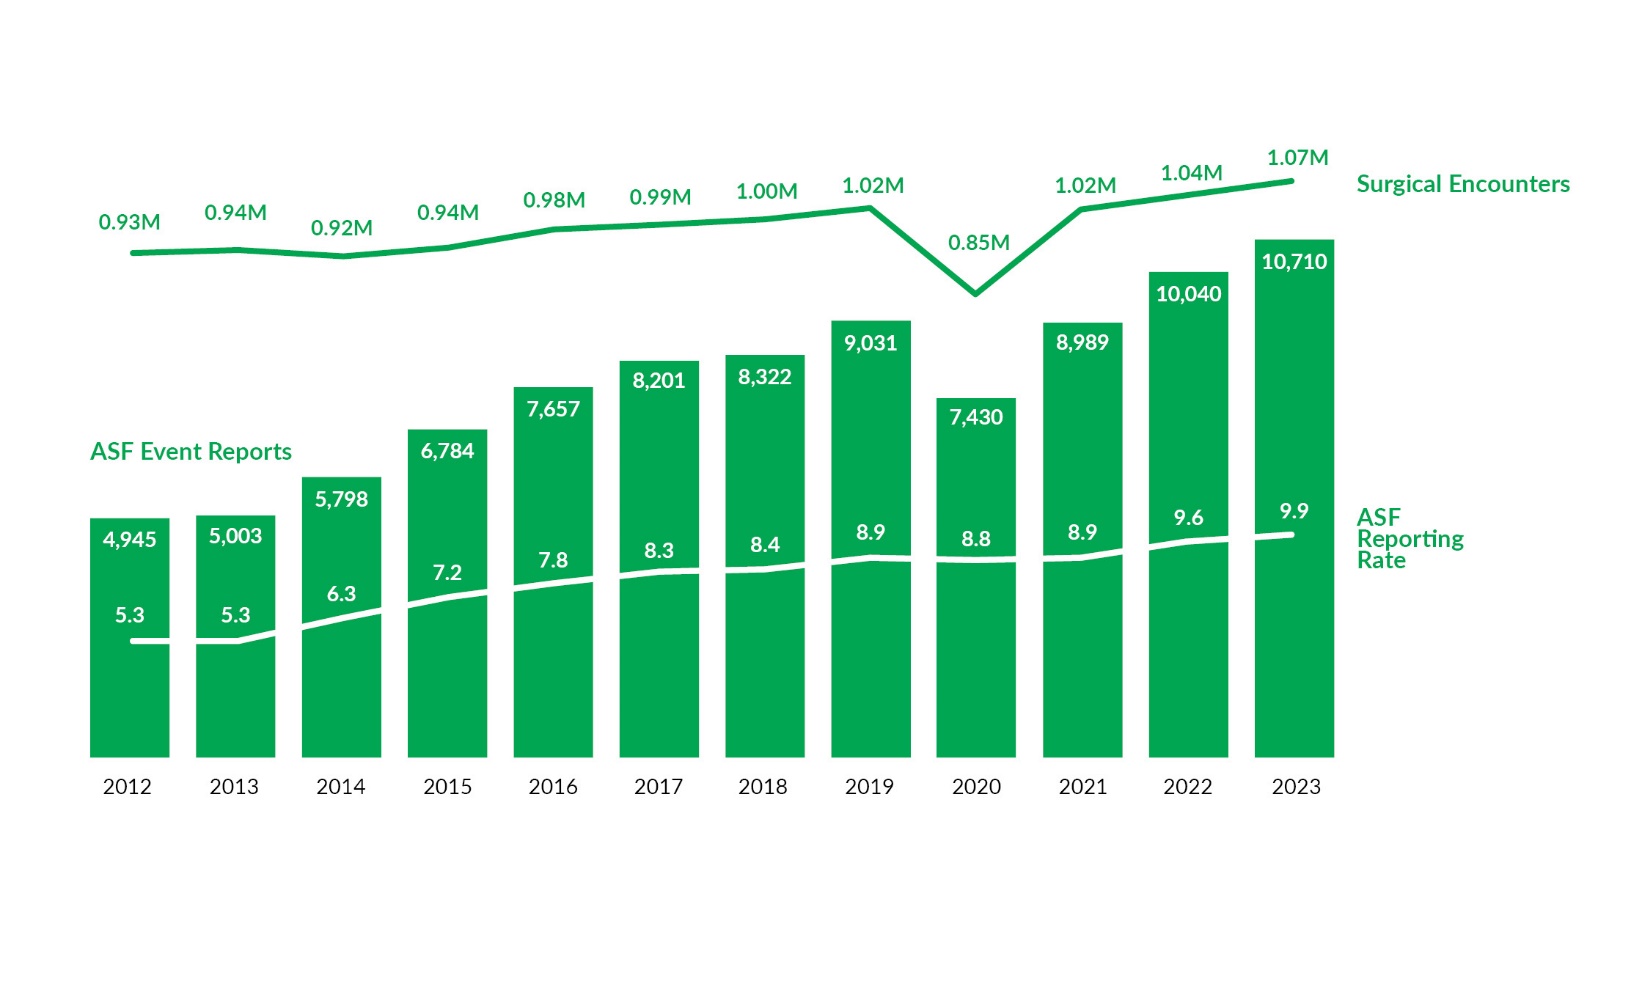
Reporting rates provide normalized comparisons over time. In this analysis, rates are based on event occurrence dates and calculated per 1,000 patient days for hospitals and per 1,000 surgical encounters for ASFs. Figure 3 shows that the preliminary rate for hospitals based on data from Q1 to Q2 of 2023 is 2.0 points higher than the 2022 full-year rate. For ASFs, Figure 4 shows the 2023 preliminary rate is 0.3 points higher than the 2022 full-year rate. Of note, there has been a relatively steady increase in the ASF reporting rate over time.


Event Types
Each PA-PSRS report includes an event type and subtype(s) that are assigned by the reporting facility. The reporting taxonomy for incidents and serious events provides for 10 main event types, with 228 possible combinations of event type and subtype(s).
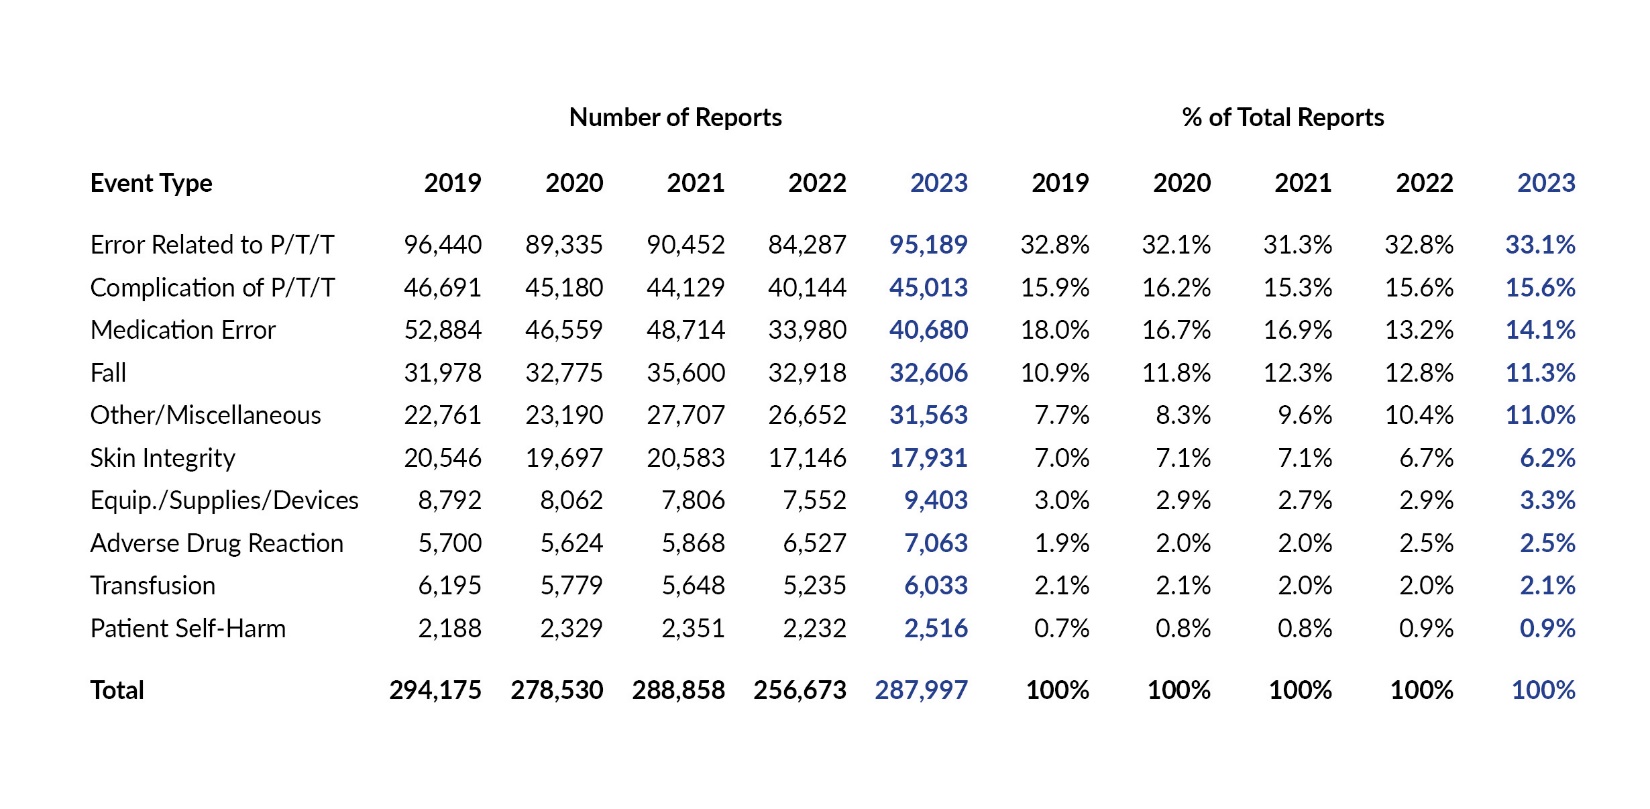
Table 4 shows the number and percentage of total reports submitted for each main event type over the past five years. For each of the past five years, the most frequently reported event type was Error Related to Procedure/Treatment/Test (P/T/T), with 95,189 reports submitted in 2023 (33.1% of total reports). From a distribution perspective, the greatest increase in percent of total reports in 2023 compared to 2022 occurred with event type Medication Error, which increased by 0.9 percentage points, from 13.2% in 2022 to 14.1% in 2023. The largest decrease occurred with event type Fall, which dropped 1.5 percentage points, from 12.8% in 2022 to 11.3% in 2023. The only raw number decrease in submitted reports was with the Fall event type, going from 32,918 reports in 2022 to 32,606 in 2023.

Table 5 shows the number and percentage of serious events submitted for each event type over the past five years. The most frequently reported serious event type for each of the last five years was Complication of P/T/T, with 6,590 serious event reports submitted in 2023 (56.1% of serious event reports). Complication of P/T/T also showed the greatest increase in terms of distribution of serious event reports, increasing by 2.6 percentage points, from 53.5% of serious events in 2022 to 56.1% in 2023. Similar to our findings for total reports, the largest decrease for serious events was seen with the Fall event type, which dropped 2.4 percentage points in 2023. Fall was also the only event type that had a raw number decrease in serious events in 2023.

Event Subtypes
Each of the 10 main event types has between six and 13 subtypes to further classify the event. The total number of reports and serious events, as well as their associated percentage distributions, are shown in Table 6. This is a detailed accounting of reports submitted in 2023 by the first level of subtype for each main event type. The main event types in the left column are listed in descending order by their number of reports (i.e., the same ordering as Table 4). Within each main event type, the subtypes are listed in descending order as well.

The subtype with the largest increase in number of reports submitted from 2022 to 2023 was Laboratory test problem, which increased by 4,267 reports. The second highest increase was in the Other (specify) subtype of the Other/Miscellaneous event type, which increased by 3,604 reports. The third largest increase was seen in the Referral/consult problem subtype, which increased by 2,542 reports.
For serious events, the top three increases were all subtypes of the Complication of P/T/T event type. The subtype accounting for almost half (48.2%; 968 of 2,009) of the increase was Complication following surgery or invasive procedure, and 54.6% (529 of 968) of reports in this subtype were due to unplanned returns to the operating room (OR). The second and third largest increases were seen in the Maternal complication and Other (specify) subtypes, which increased by 159 and 121 reports, respectively.
Event Type and Harm Score
Table 7 displays a cross tabulation of submitted reports distributed by harm score for each of the 10 main event types. Colored cells reflect the intersections of event type and harm score that occurred most frequently in 2023, with darker shades representing higher concentrations of reports. For the most frequently reported event type, Error Related to P/T/T, harm score C was reported most frequently; this intersection of event type and harm score was the most common in 2023, with 46,750 reports and representing 16.2% of total reports. The second most common intersection was seen with event type Complication of P/T/T and harm score D, with 22,314 reports and representing 7.7% of total reports.

Care Area and Harm Score
The care area can help us identify patterns or trends involving specific patient safety concerns relative to the location where an event occurred. Within the acute care data, there are 168 care area options for facilities to use; we then place these care areas into one of 23 higher-level care area groups. Table 8 shows a cross tabulation of care area group with harm score. This reflects the same two areas of highest concentration that were seen in the 2022 data, in the cross sections of the Med/Surg care area group and harm scores C and D. Together, these account for 15.3% of total reports submitted in 2023.

Care Area and Event Type
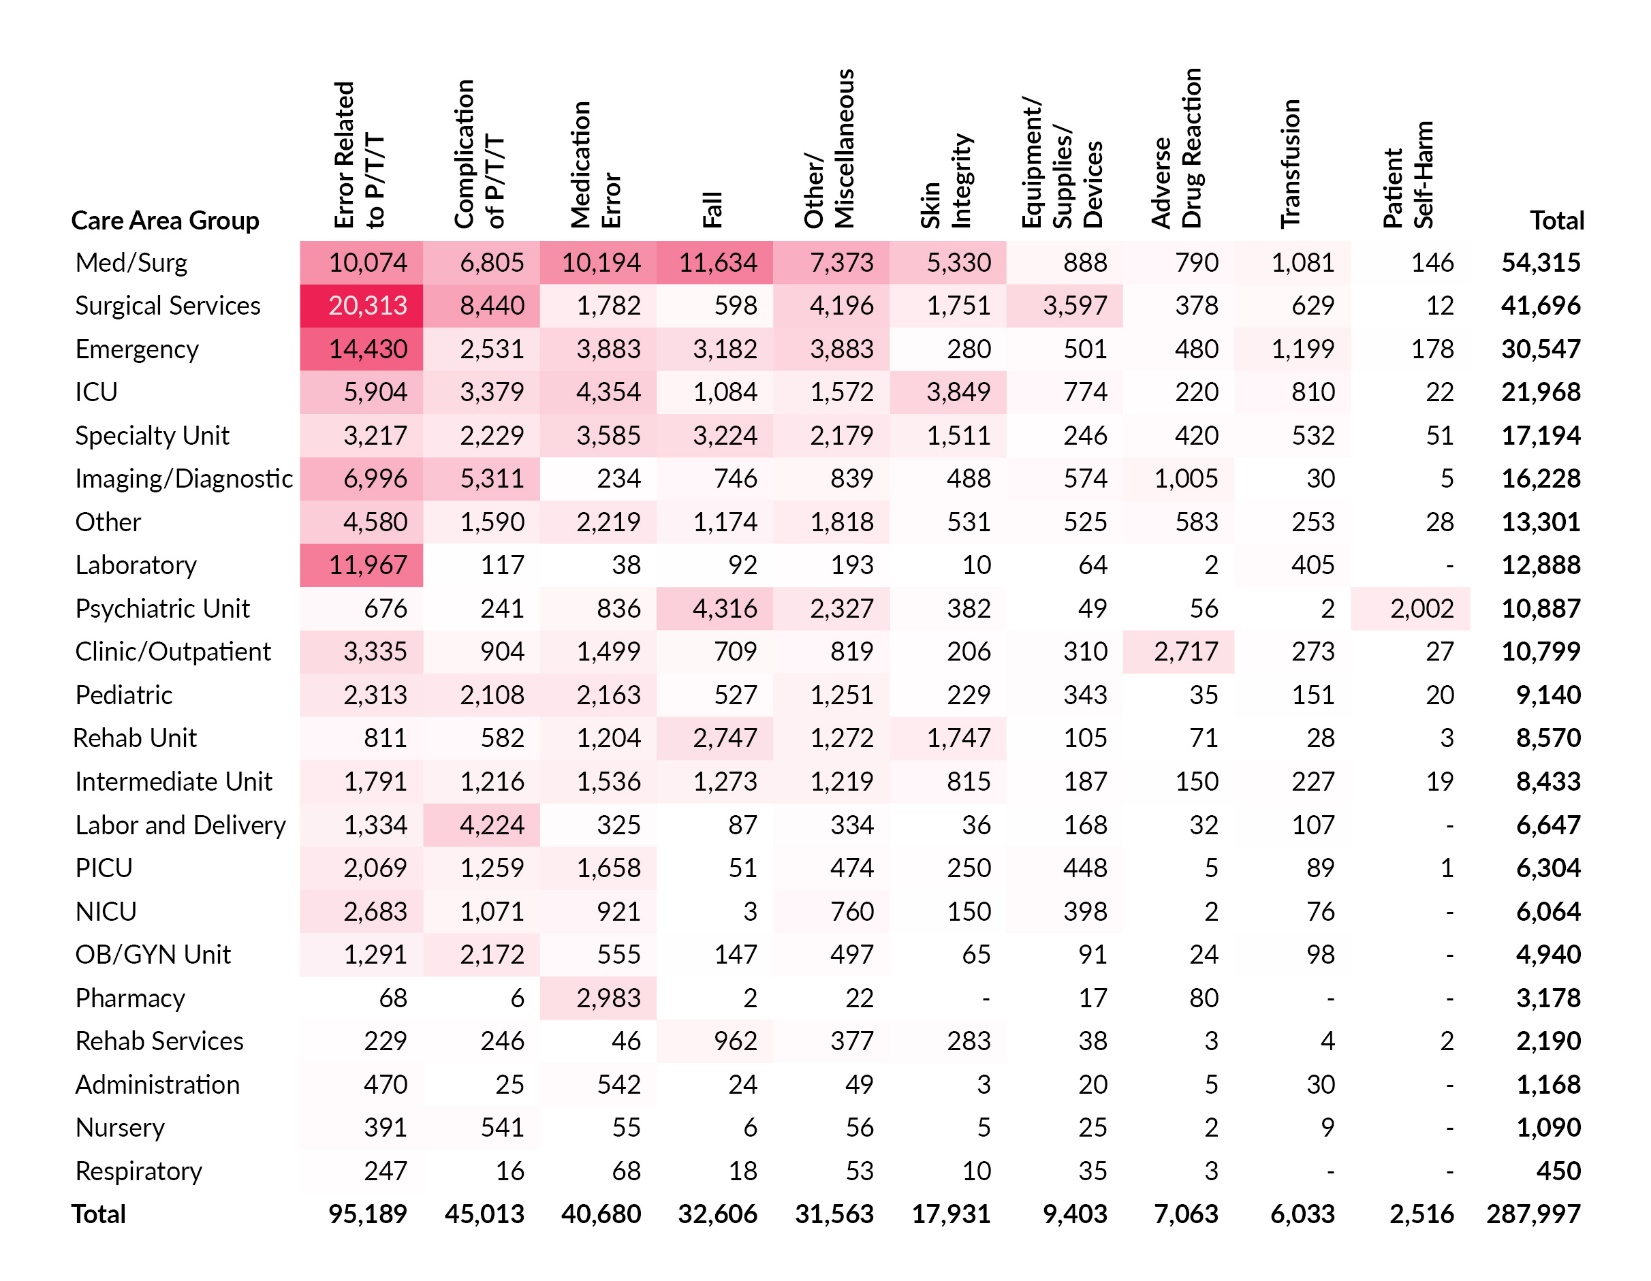
Table 9 shows a cross tabulation of care area group and event type. The three highest concentrations of reports are at the intersections of Error Related to P/T/T with Surgical Services, Emergency, and Laboratory care area groups.

Other Acute Care Facilities
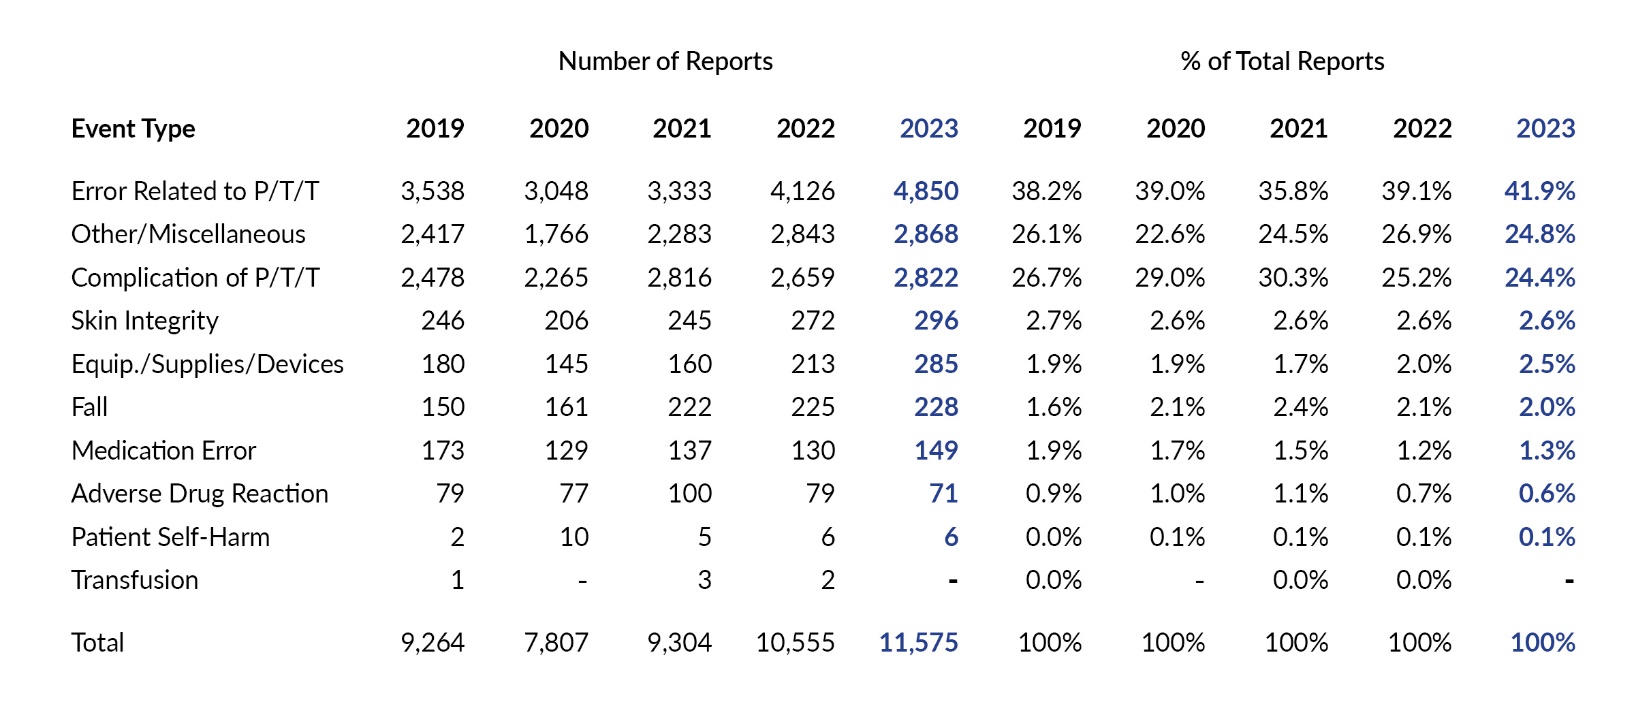
Since the acute care data predominately reflects reports from hospitals, it is important to separately analyze data from the other acute care facilities (comprised mostly of ASFs, along with BRCs and ABFs) to identify reported patient safety issues from those settings. Table 10 shows the distribution of reports submitted by these other acute care facilities across the 10 main event types over the past five years. These facilities show a different distribution compared to the overall data in Table 4. In comparing the percentage of total reports submitted by all facilities to those submitted by other acute facilities in 2023, the largest difference is seen with the Other/Miscellaneous event type, which made up 24.8% of total reports from other acute care facilities but only 11.0% of reports from all acute care facilities. The second largest difference is with the Medication Error event type, which made up only 1.3% of reports submitted by other acute care facilities but 14.1% of reports from all acute care facilities. The third largest difference is seen with the Fall event type, accounting for only 2.0% of reports from other acute care facilities, but 11.3% of reports from all acute care facilities.

Table 11 shows the distribution of serious events reported by other acute care facilities over the past five years. In 2023, the combination of two event types, Complication of P/T/T and Other/Miscellaneous, accounted for more than 90% of serious event reports submitted by other acute care facilities.

Discussion
The number of reports submitted to PA-PSRS has fluctuated over the last five years. Nearly 288,000 reports were received in 2023, which is a considerable increase from 2022 but very close to the 2021 total. While report counts provide some useful information, the reporting rate offers a more normalized comparison year over year. Preliminary reporting rates for 2023 show the highest rate for hospitals since 2020 and the highest rate for ASFs based on available data since 2012. The increase in number and proportion of serious events in 2023 may be attributable to the Patient Safety Authority’s (PSA) ongoing efforts to improve the accuracy of event classification (i.e., ensuring that events meeting the definition of a serious event are reported as such). For instance, PSA previously focused on accurate classification of unplanned returns to the OR, and this subset of reports accounted for the largest increase in serious events in 2023.
Conclusion
The number of total reports, serious events, and high harm events, as well as preliminary reporting rates for hospitals and ASFs, all increased in 2023. The total number of reports submitted in 2023 is similar to 2021, although reporting rates for both hospitals and ASFs have increased since that time. PSA will continue working with Pennsylvania healthcare facilities to support high-quality reporting and patient safety practices.
Note
This analysis was exempted from review by the Advarra Institutional Review Board.
Disclosure
The authors declare that they have no relevant or material financial interests.
About the Authors
Shawn Kepner (shawkepner@pa.gov) is a data scientist at the Patient Safety Authority.
Rebecca Jones is director of Data Science & Research at the Patient Safety Authority (PSA) and founder and director of the PSA’s Center of Excellence for Improving Diagnosis.
PA-PSRS is a secure, web-based system through which Pennsylvania hospitals, ambulatory surgical facilities, abortion facilities, and birthing centers submit reports of patient safety–related incidents and serious events in accordance with mandatory reporting laws outlined in the Medical Care Availability and Reduction of Error (MCARE) Act (Act 13 of 2002).1 All reports submitted through PA-PSRS are confidential and no information about individual facilities or providers is made public.
The Pennsylvania Health Care Cost Containment Council (PHC4) is an independent state agency responsible for addressing the problem of escalating health costs, ensuring the quality of healthcare, and increasing access to healthcare for all citizens regardless of ability to pay. PHC4 has provided data to this entity in an effort to further PHC4’s mission of educating the public and containing healthcare costs in Pennsylvania. PHC4, its agents, and its staff have made no representation, guarantee, or warranty, express or implied, that the data—financial-, patient-, payor-, and physician-specific information—provided to this entity are error-free, or that the use of the data will avoid differences of opinion or interpretation. This analysis was not prepared by PHC4. This analysis was done by the Patient Safety Authority. PHC4, its agents, and its staff bear no responsibility or liability for the results of the analysis, which are solely the opinion of this entity.