
Introduction
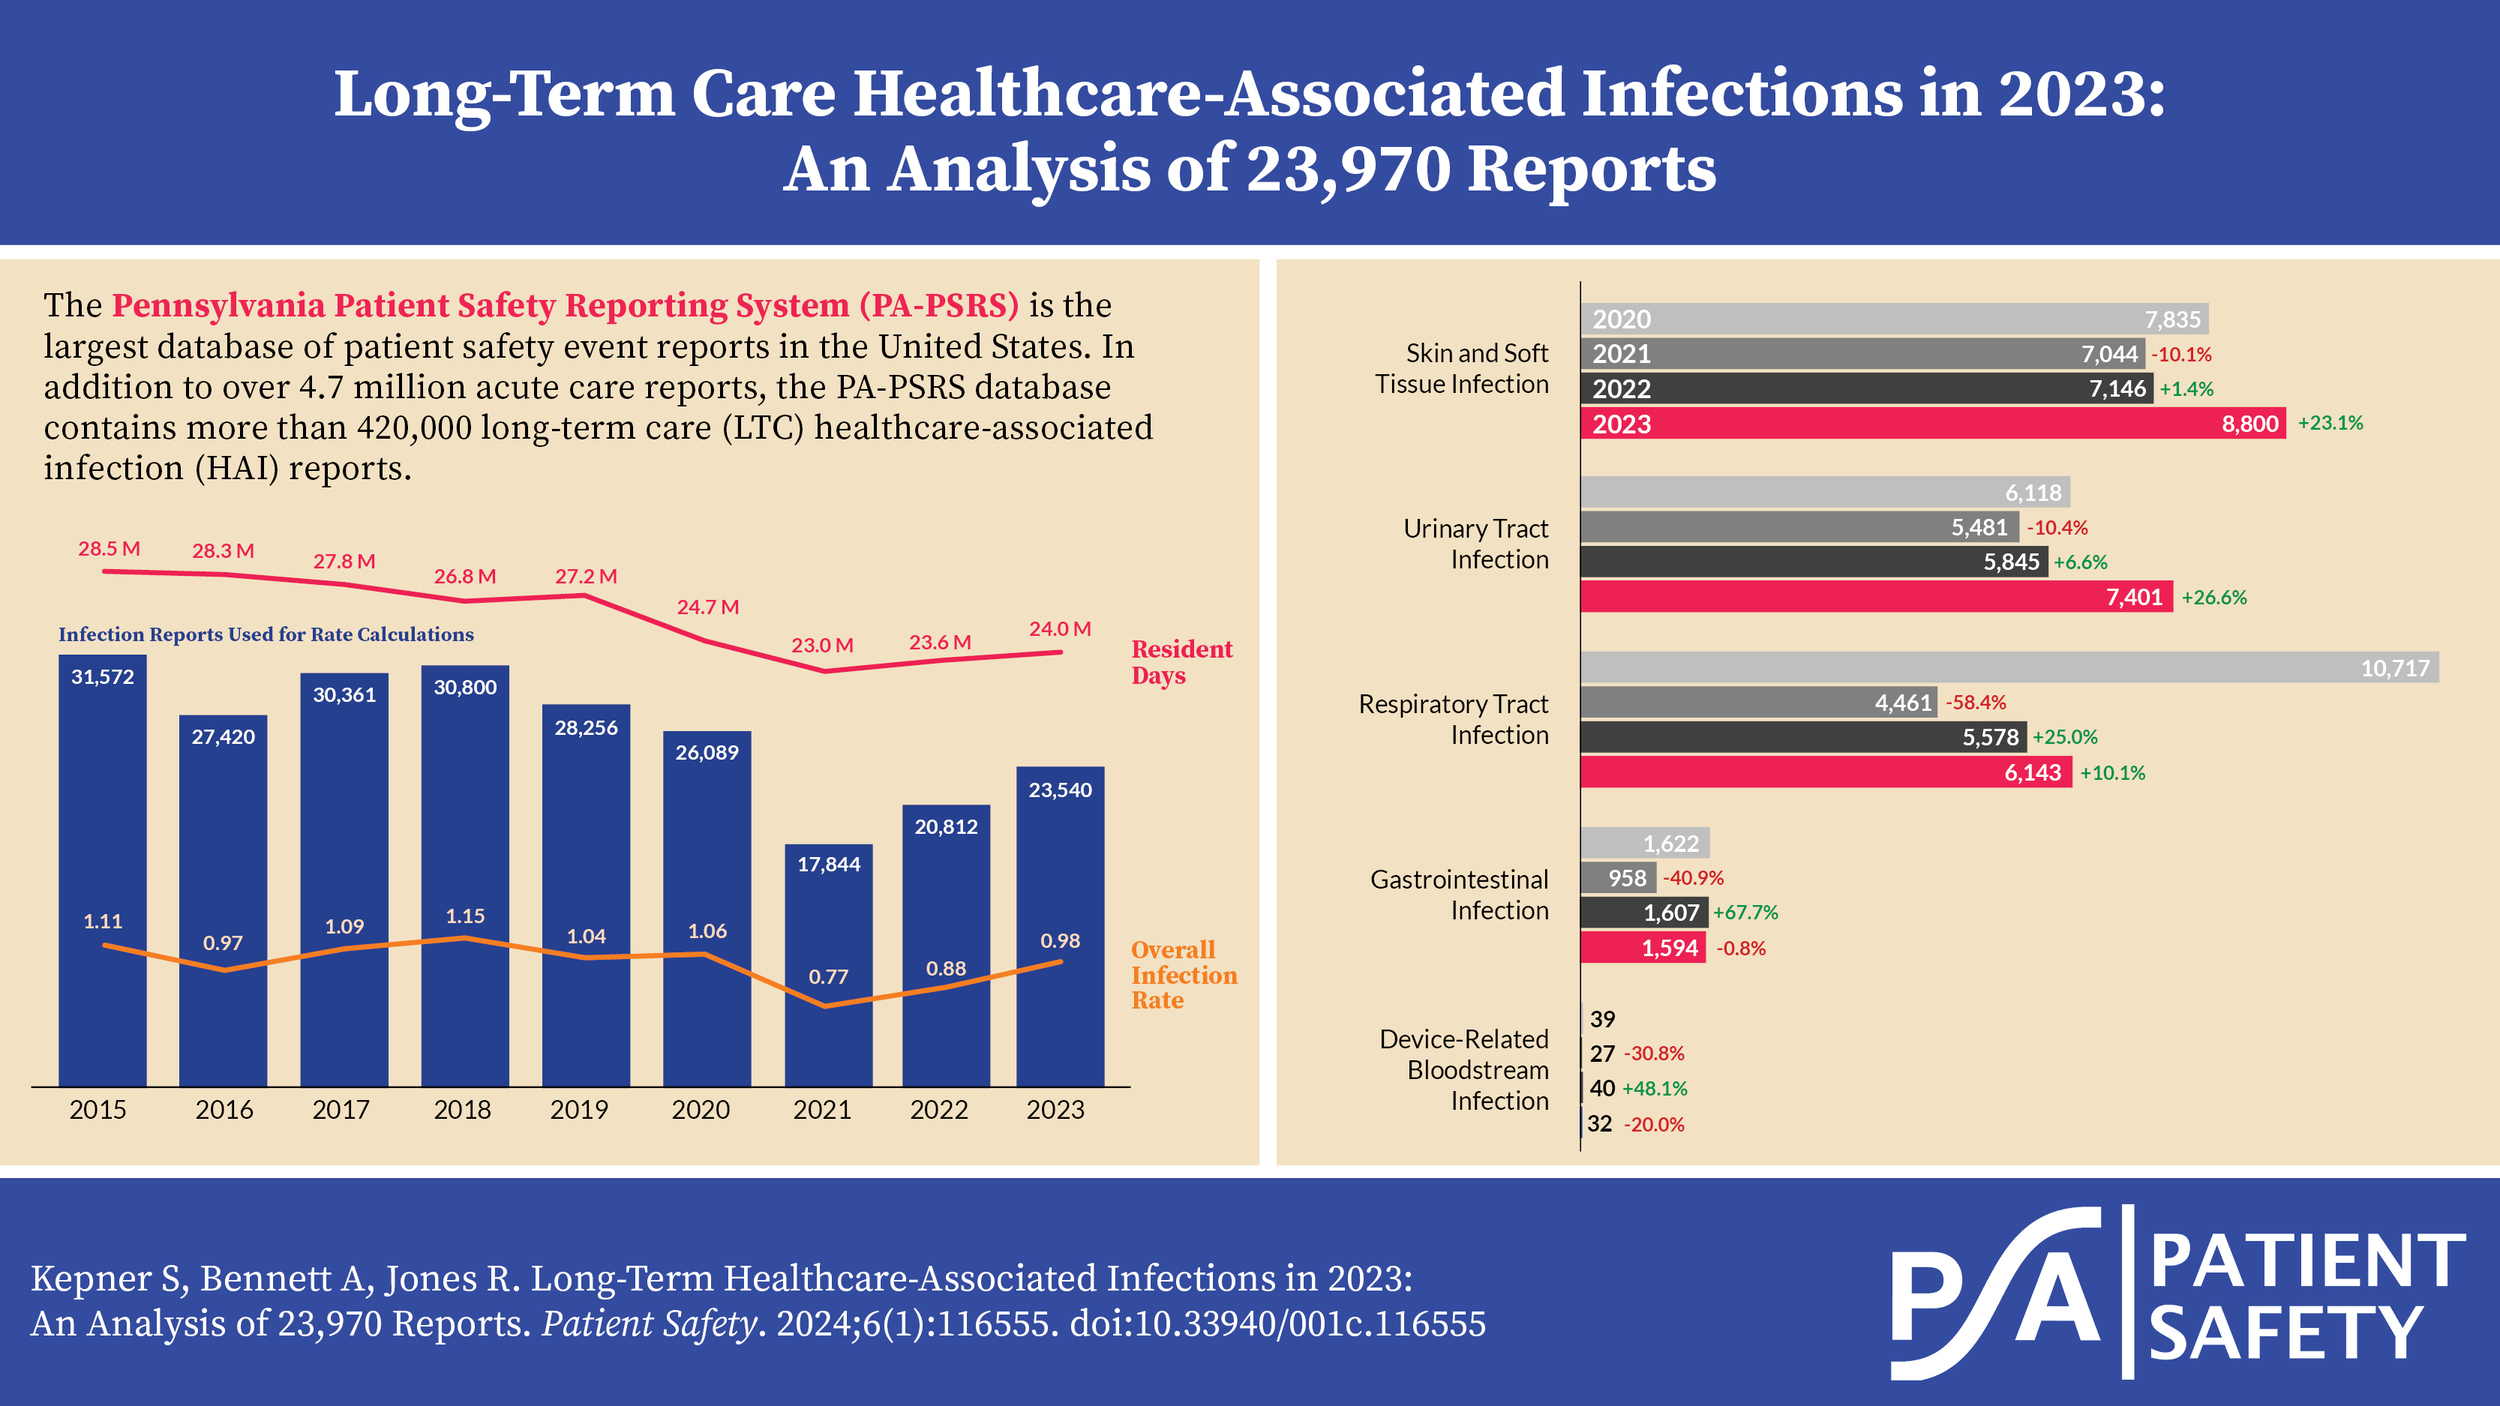
The Pennsylvania Patient Safety Reporting System (PA-PSRS)[1] is the largest repository of patient safety data in the United States. In addition to over 4.7 million acute care records, PA-PSRS has collected more than 420,000 long-term care (LTC) healthcare-associated infection (HAI) reports since 2009.
Methods
The LTC data from PA-PSRS were extracted on March 1, 2024, to allow additional time for rate calculations based on resident and device utilization days. Report counts for infections are based on the report submission date. Overall rates are based on the infection confirmation date and calculated per 1,000 resident days. Infection rates related to urinary catheters or central lines are calculated per 1,000 urinary catheters or 1,000 central line days, respectively. Reports submitted by LTC facilities and specific care areas were included in rate calculations if resident and device days were entered in PA-PSRS for the corresponding month.
Results
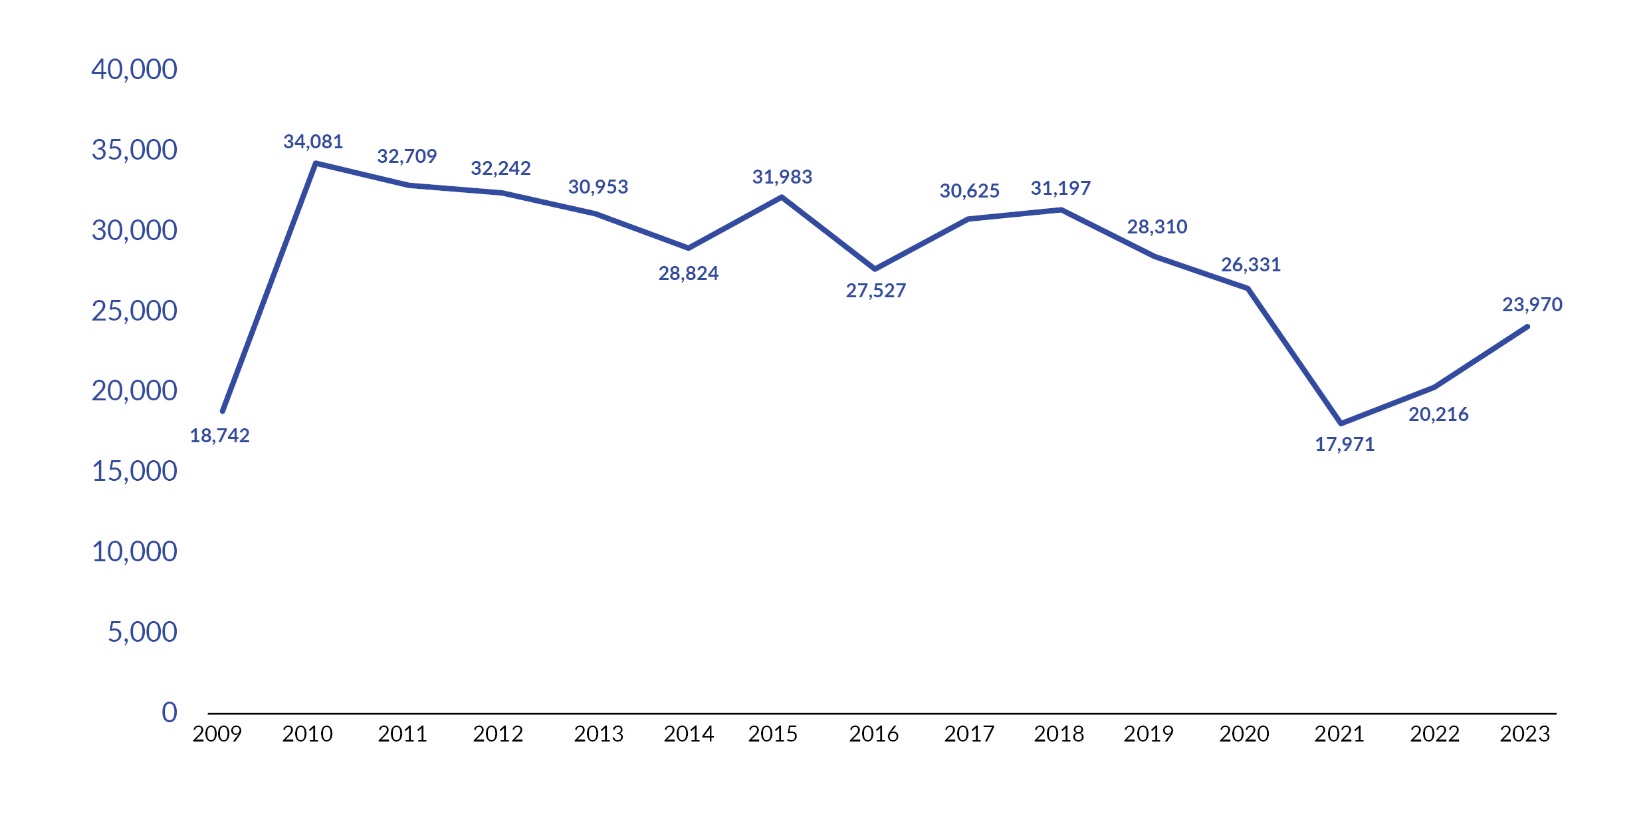
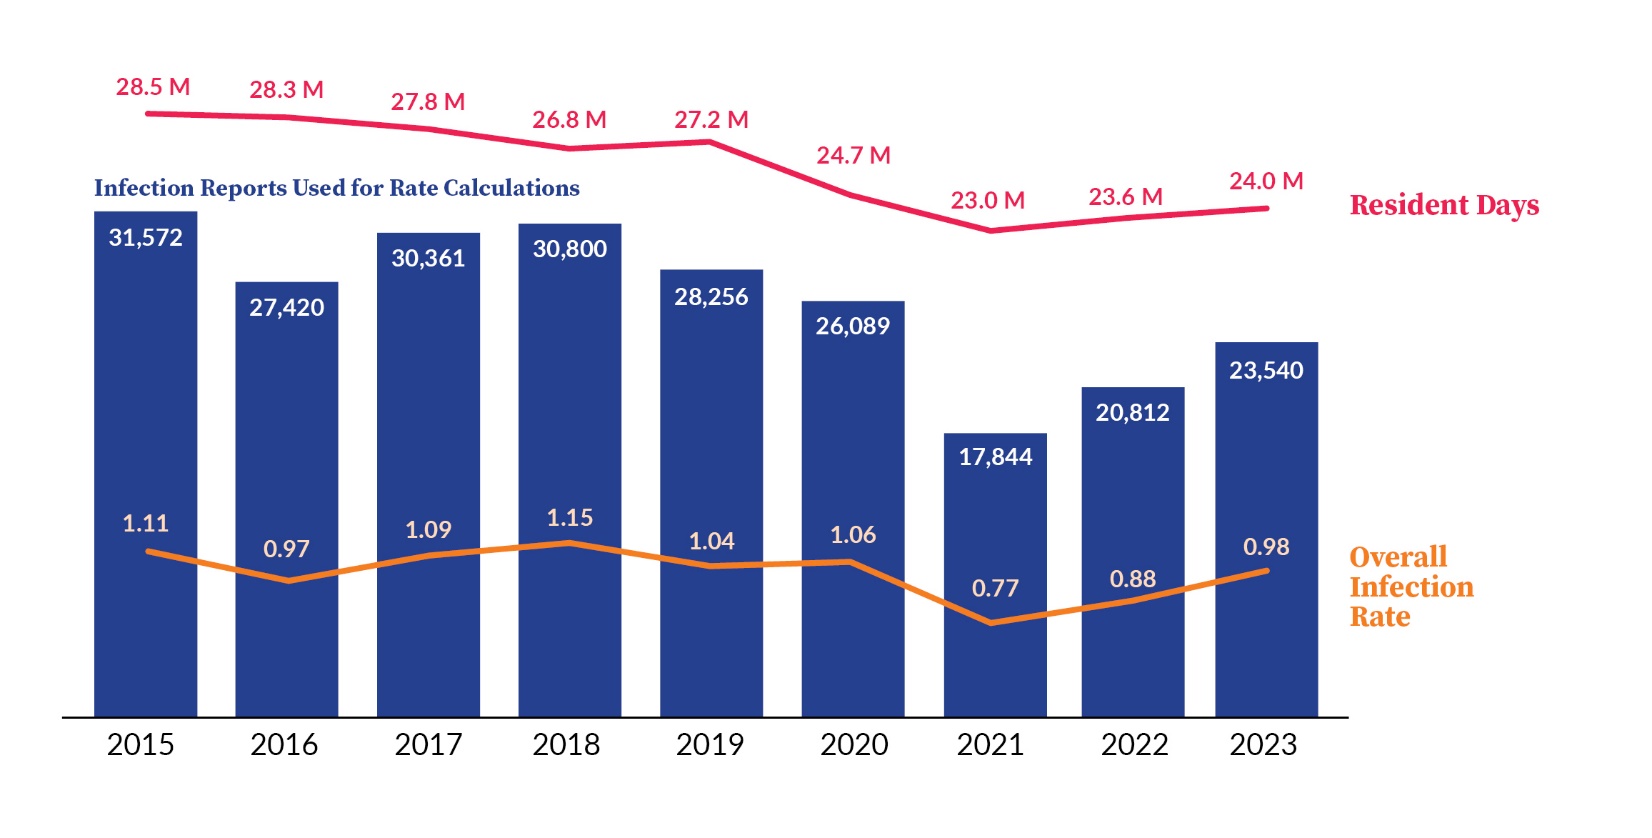
Pennsylvania’s LTC facilities submitted 23,970 infection reports to PA-PSRS in 2023, which is an 18.6% increase over the prior year (see Figure 1). As shown in Figure 2, the overall infection rate in 2023 was 0.98 infections per 1,000 resident days, representing an 11.4% increase from 2022.


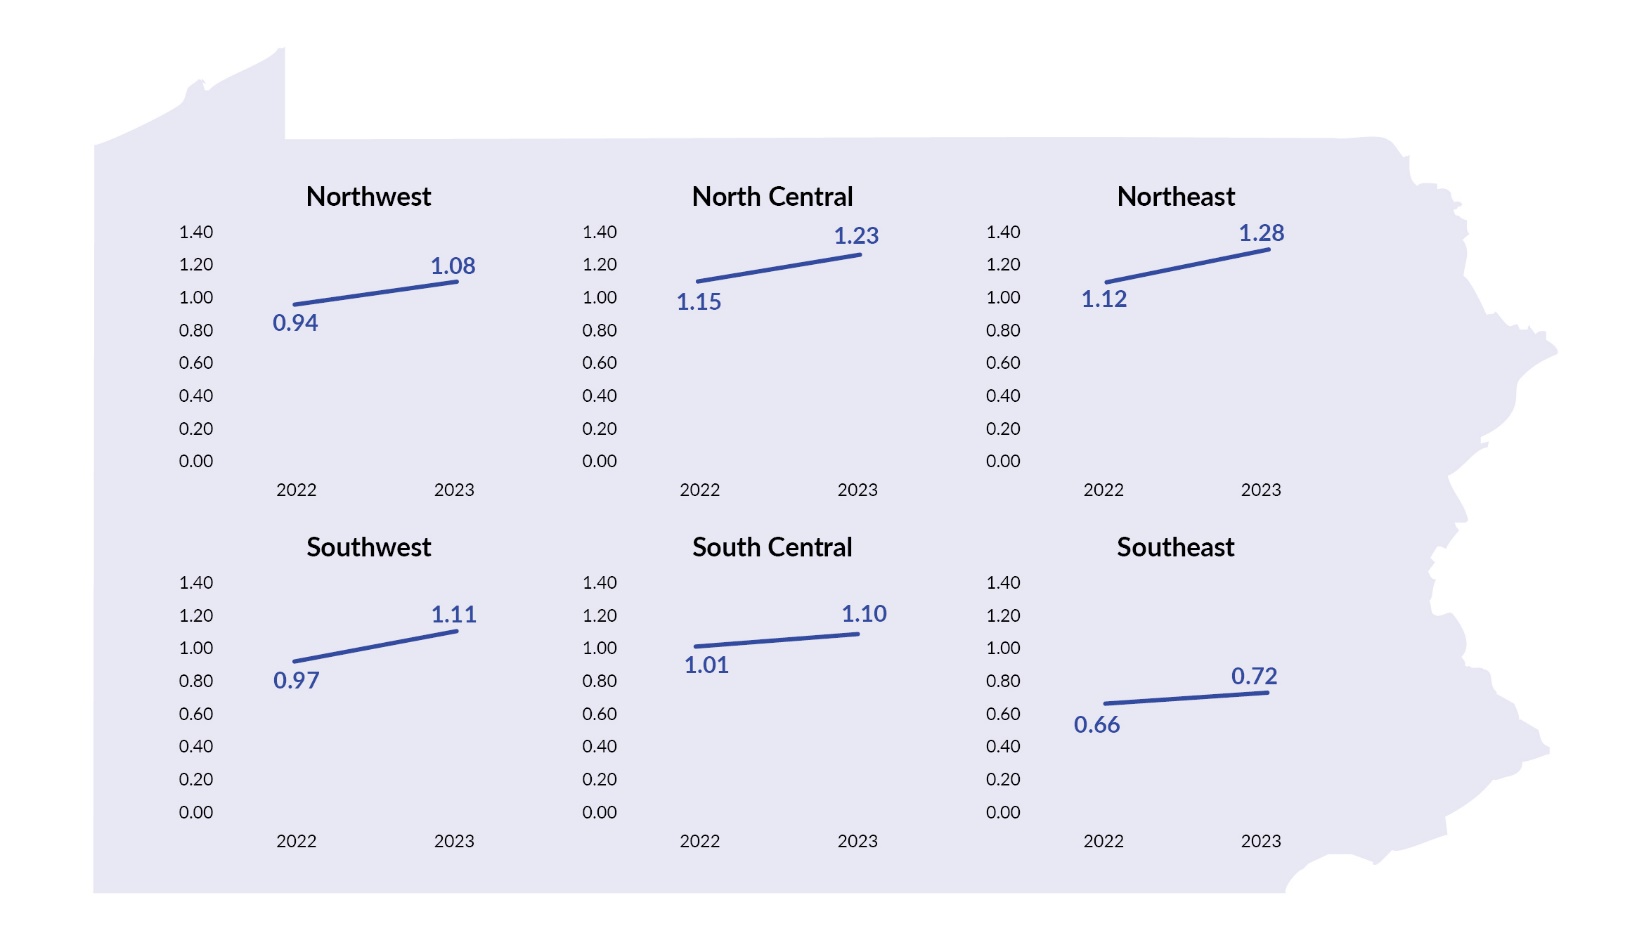
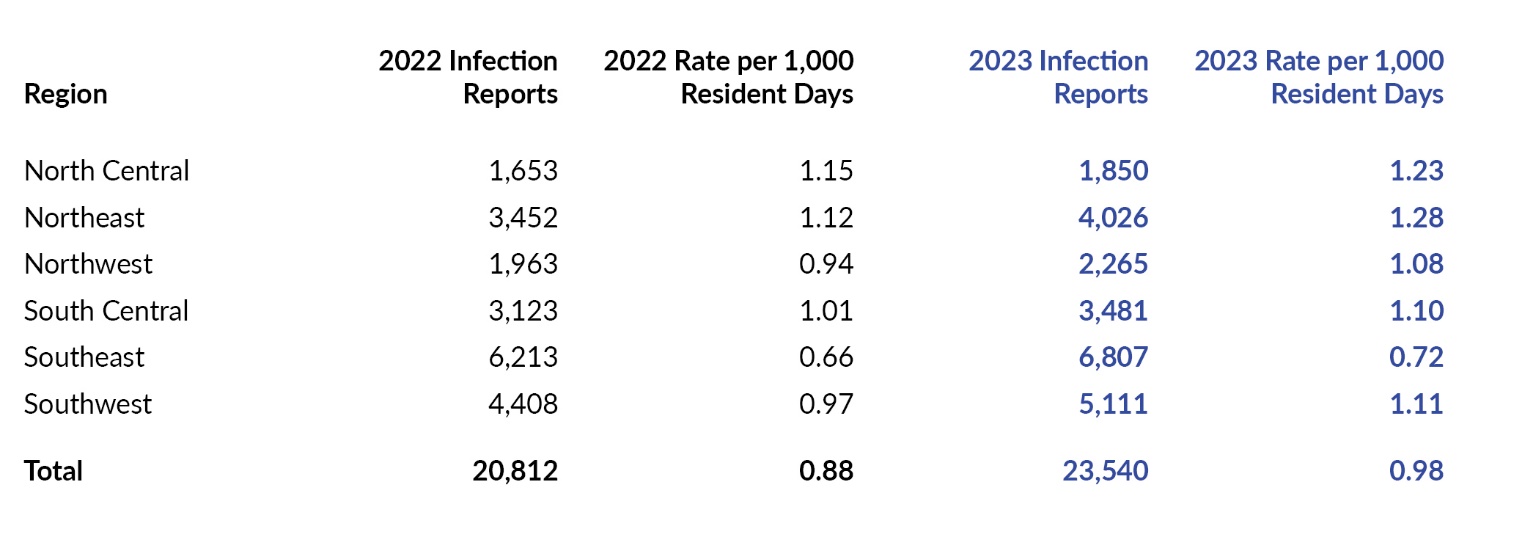
Figure 3, which displays infection rates by region, shows that all six regions of the state had an increase in infection rate from 2022 to 2023. The Northeast region had the highest infection rate in 2023, with 1.28 reports per 1,000 resident days, and the Southeast region had the lowest rate, at 0.72. The distribution of LTC infection reports and infection rates by region are shown in Table 1.


LTC Healthcare-Associated Infections
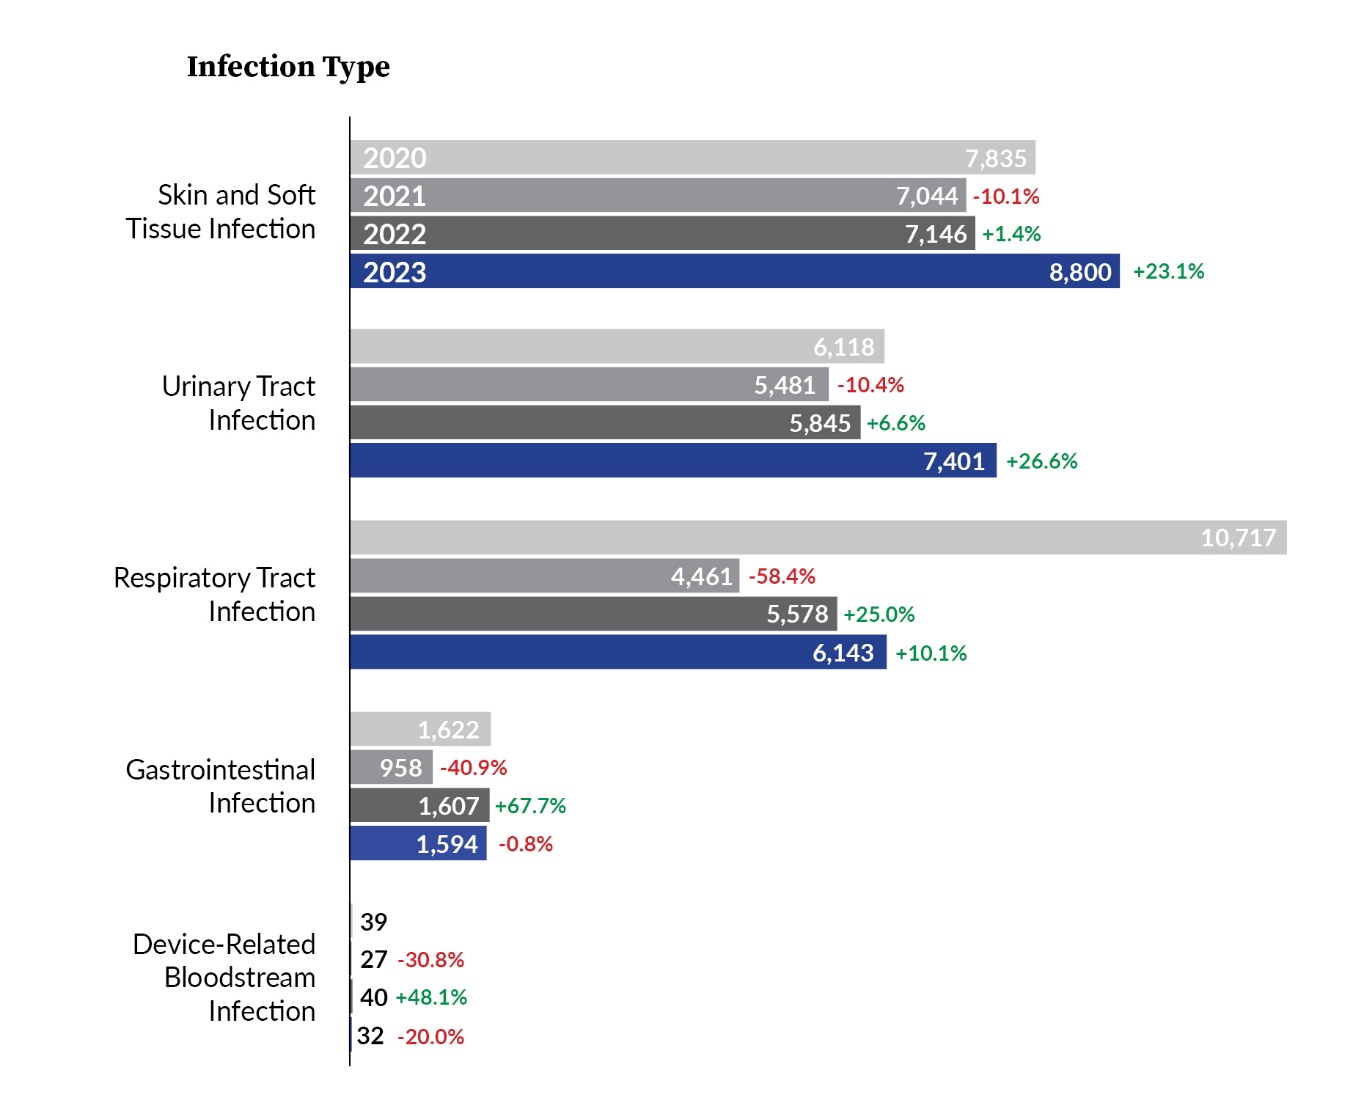
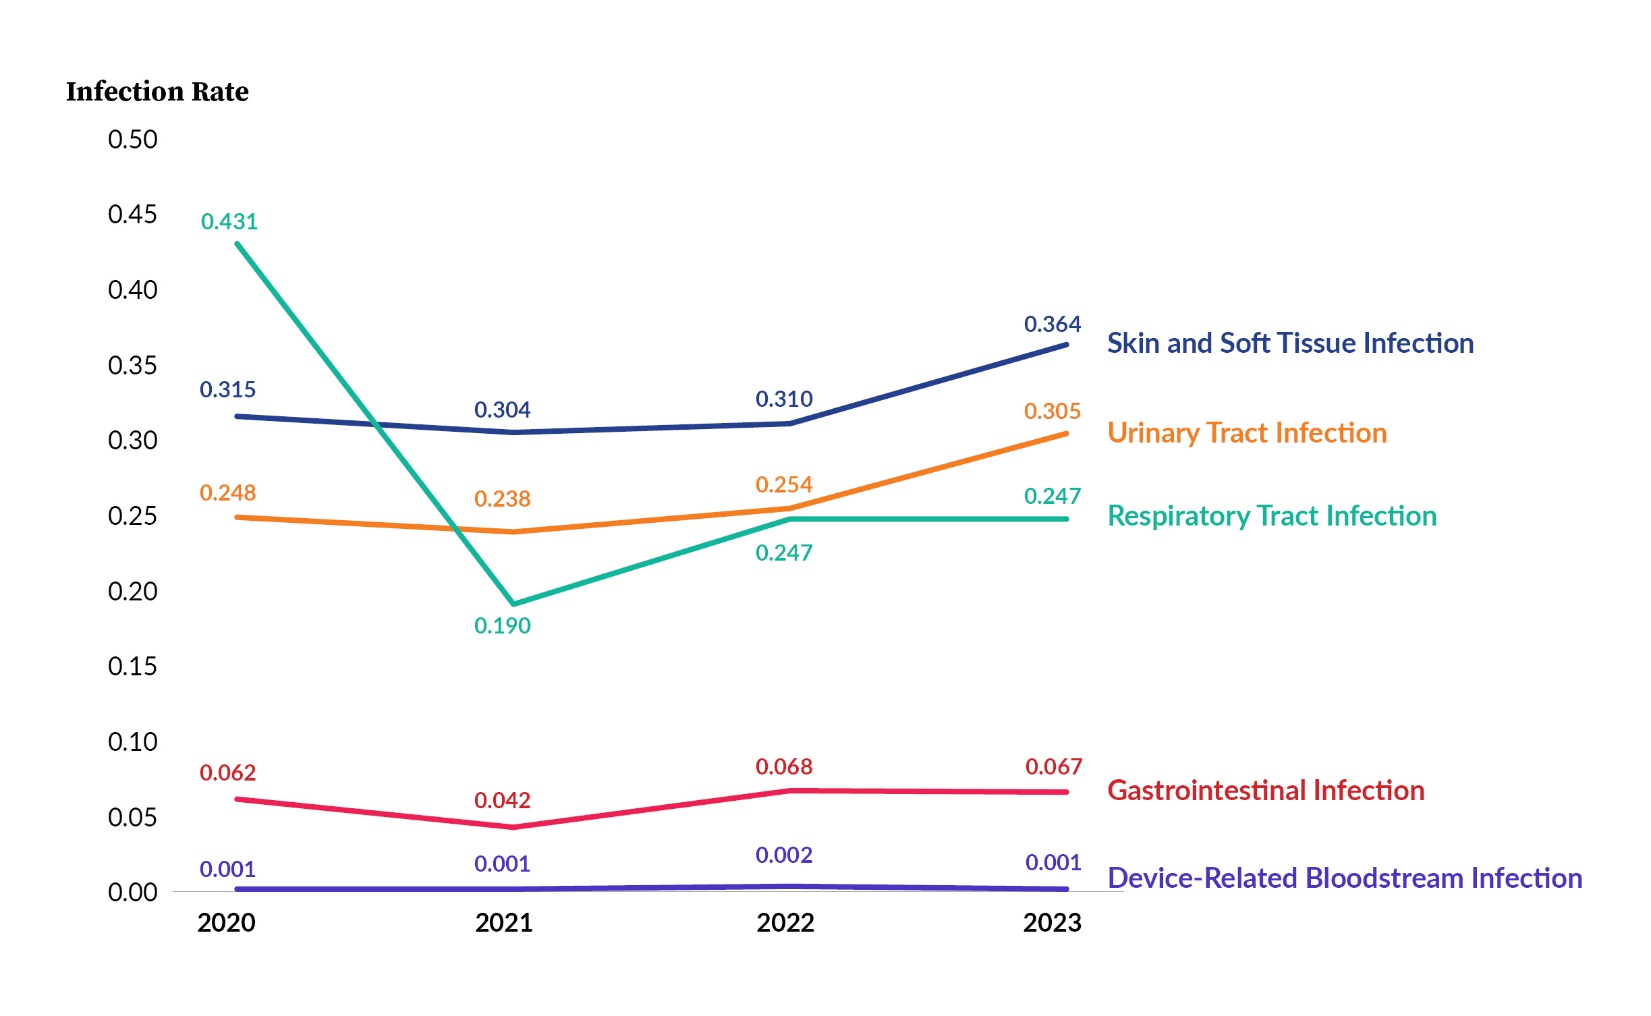
Reports submitted by LTC facilities to PA-PSRS are classified into five main infection types (see Figure 4). In 2020, respiratory tract infections (RTI) were the most frequently reported infection type. For the last three years, skin and soft tissue infections (SSTI) were the most frequently reported, followed by urinary tract infections (UTI) and RTI. The number of reports submitted for all three of these infection types increased in 2023, with the top two showing large increases of 23.1% and 26.6%, respectively.

LTC Healthcare-Associated Infection Subtypes
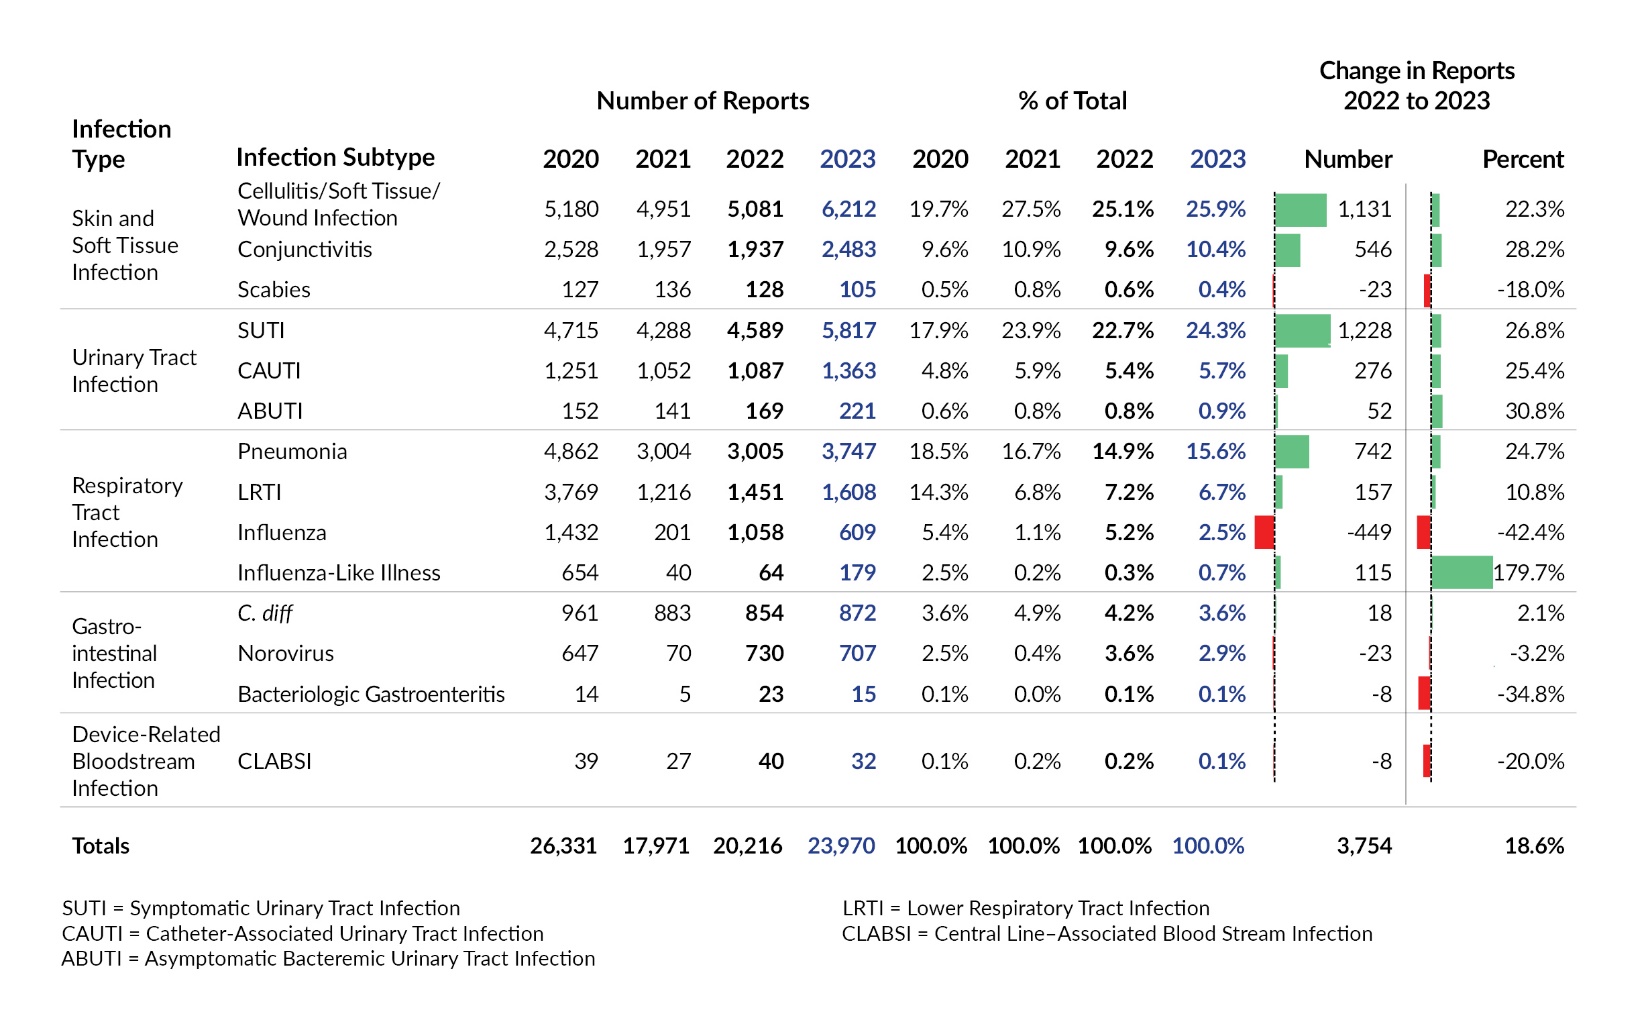
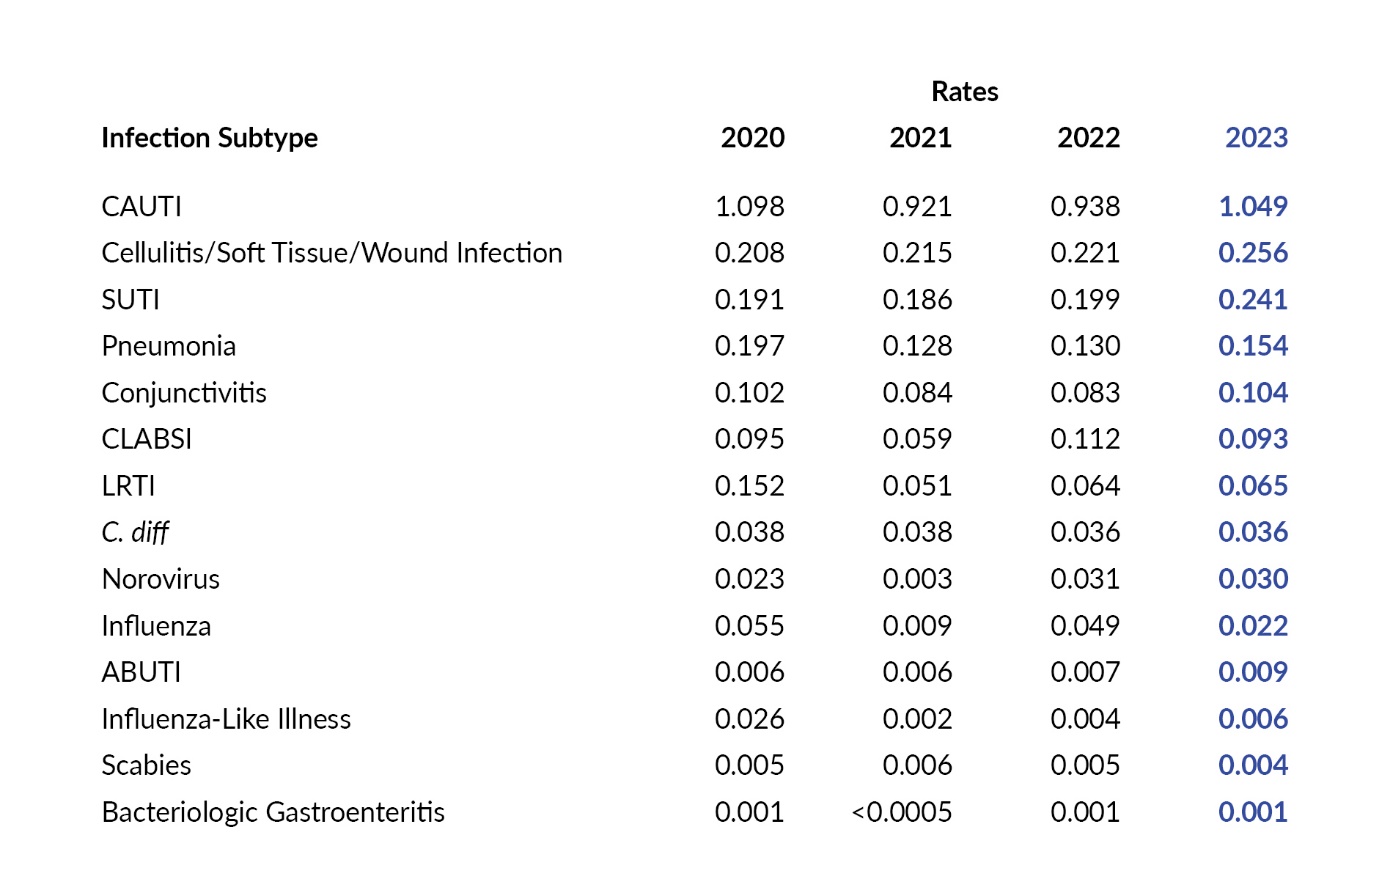
Table 2 shows the number of reports submitted for all infection subtypes for the past four years. The most frequently reported subtype in 2023 was cellulitis, soft tissue, or wound infection, followed by symptomatic urinary tract infection (SUTI) and pneumonia, which is the same top-three subtype ordering as the prior two years. Of the 14 infection subtypes, nine had an increase in number of reports submitted in 2023 compared to 2022, with SUTI showing the largest increase of 1,228 reports. Influenza-like illness had the largest percentage increase of 179.7%, going from 64 reported infections in 2022 to 179 in 2023. Of the five subtypes that decreased in number, influenza had the largest decrease, dropping by 449 reports from 2022 to 2023.

Care Area
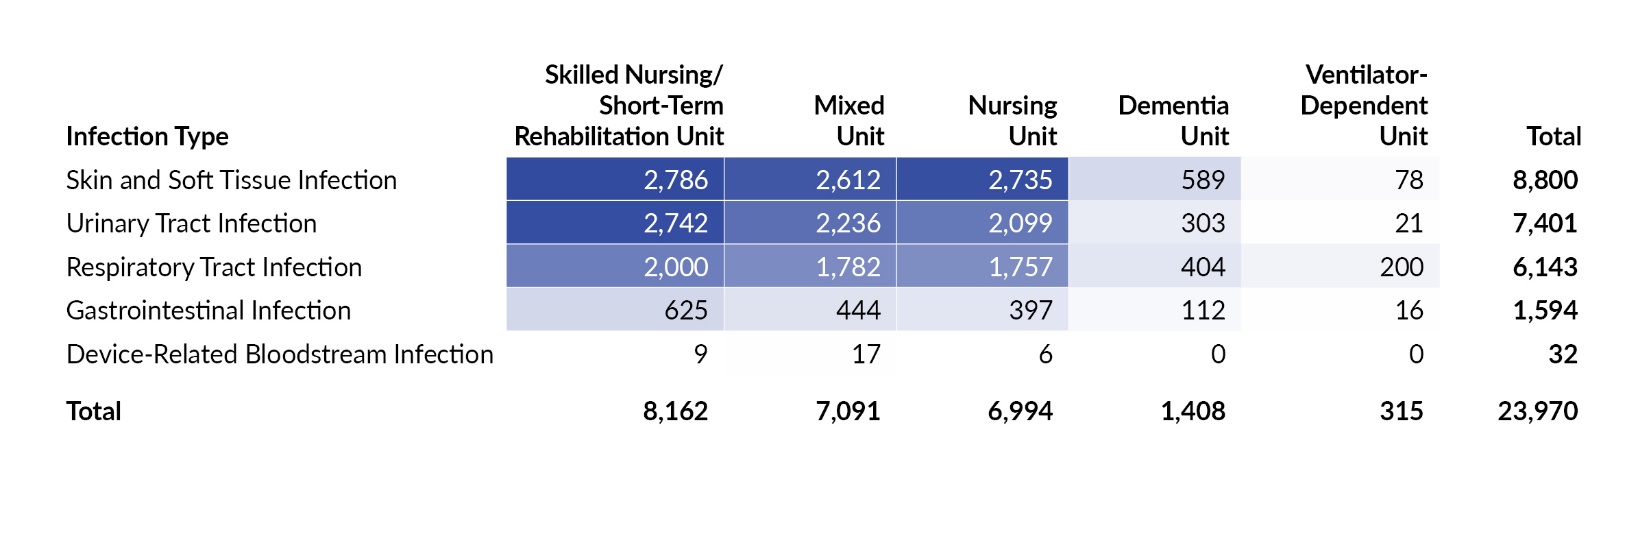
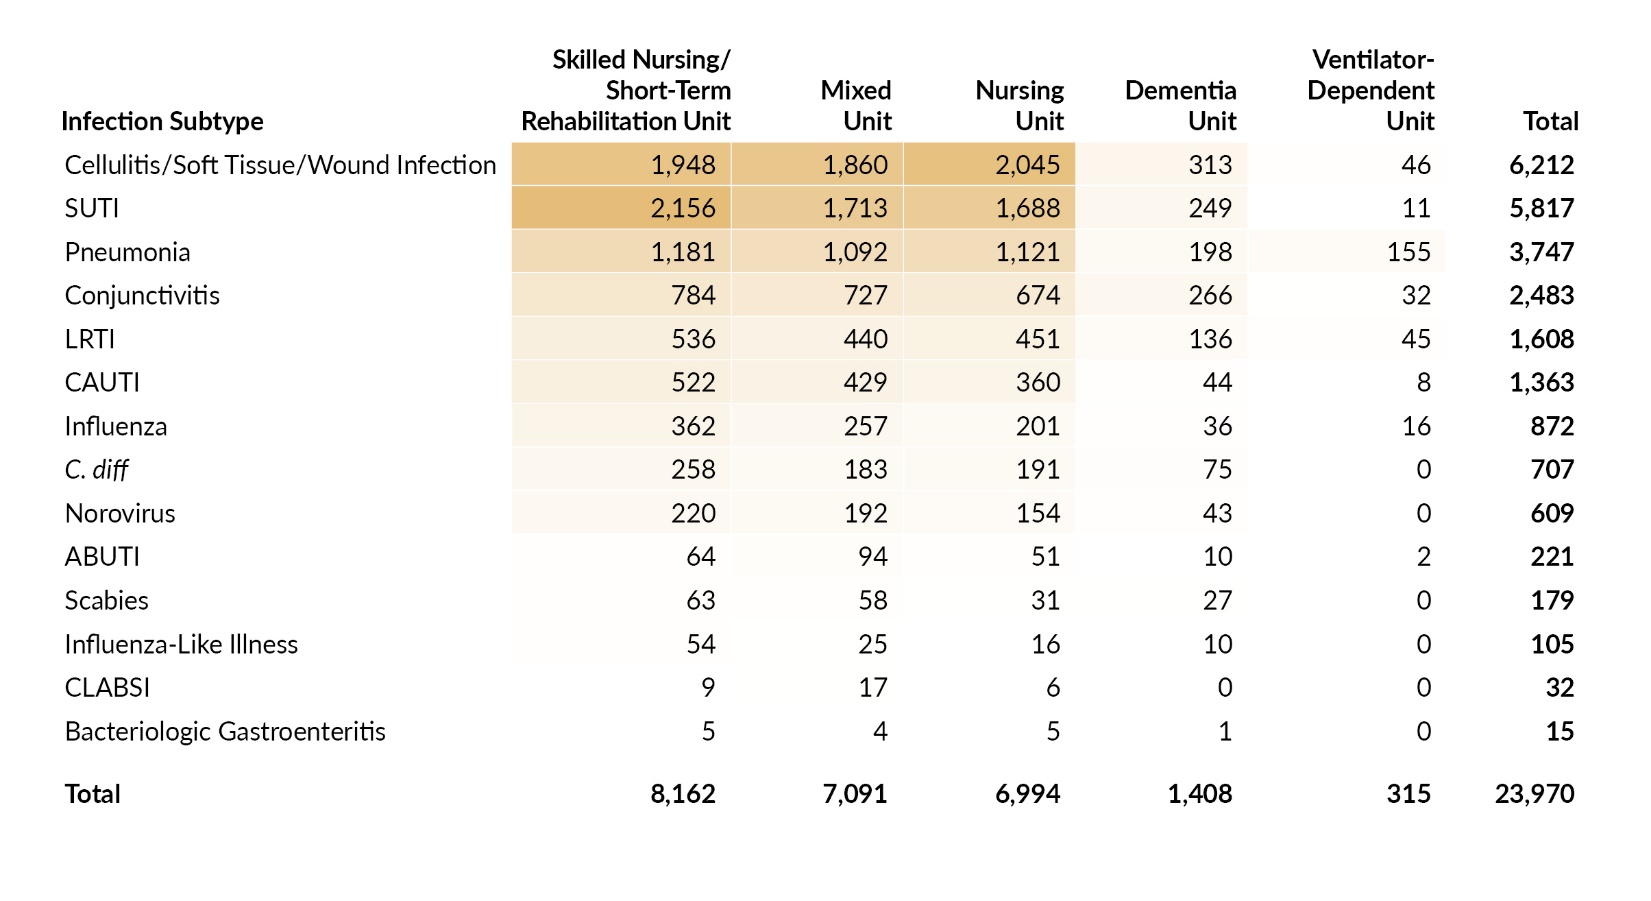
Table 3 shows the distribution of 2023 reports by infection type and care area. Skilled nursing/short-term rehabilitation units accounted for the largest proportion of infections (34.1%; 8,162 of 23,970). In 2023, SSTI were reported more than any other infection type in all care areas except ventilator-dependent units, in which RTIs were reported most frequently. Table 4 shows the 2023 distribution of infection reports by infection subtype and care area. As was the case in 2022, the largest concentration of reports in 2023 was seen with SUTI in skilled nursing/short-term rehabilitation units.


LTC Healthcare-Associated Infection Rates
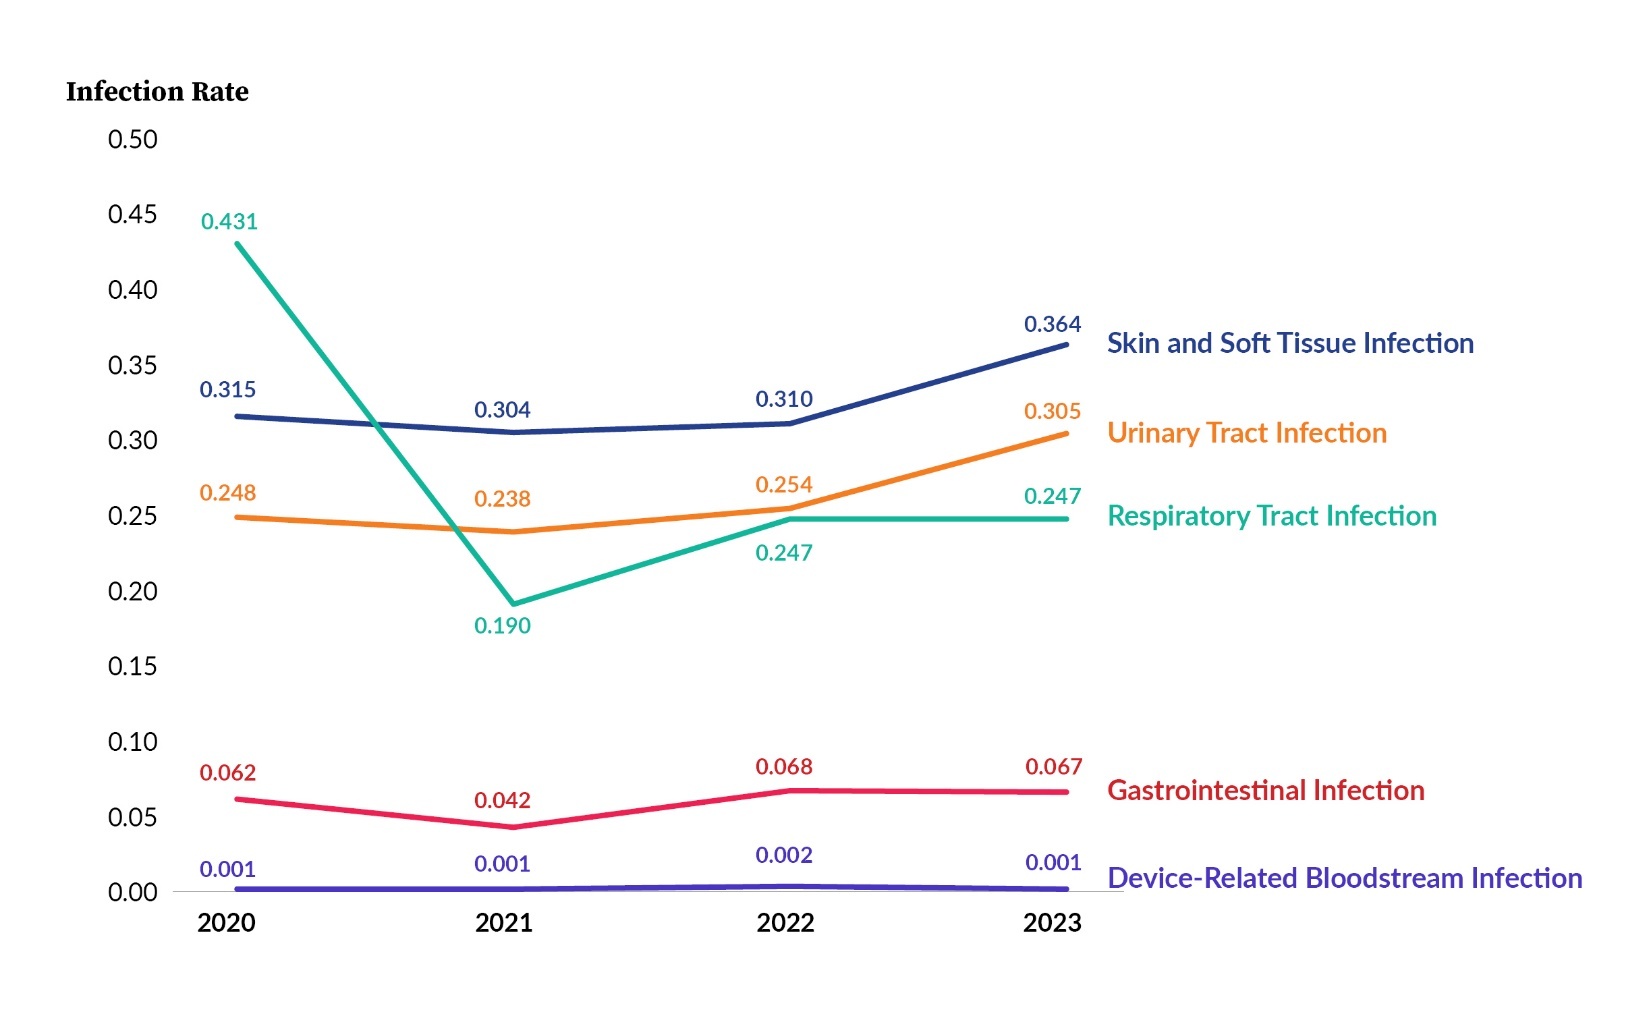
Figure 5 shows rates per 1,000 resident days for the five main infection types for 2020 through 2023. The increase in overall rate in 2023 was driven by increases in the UTI and SSTI rates, which increased by 20.1% and 17.4%, respectively.
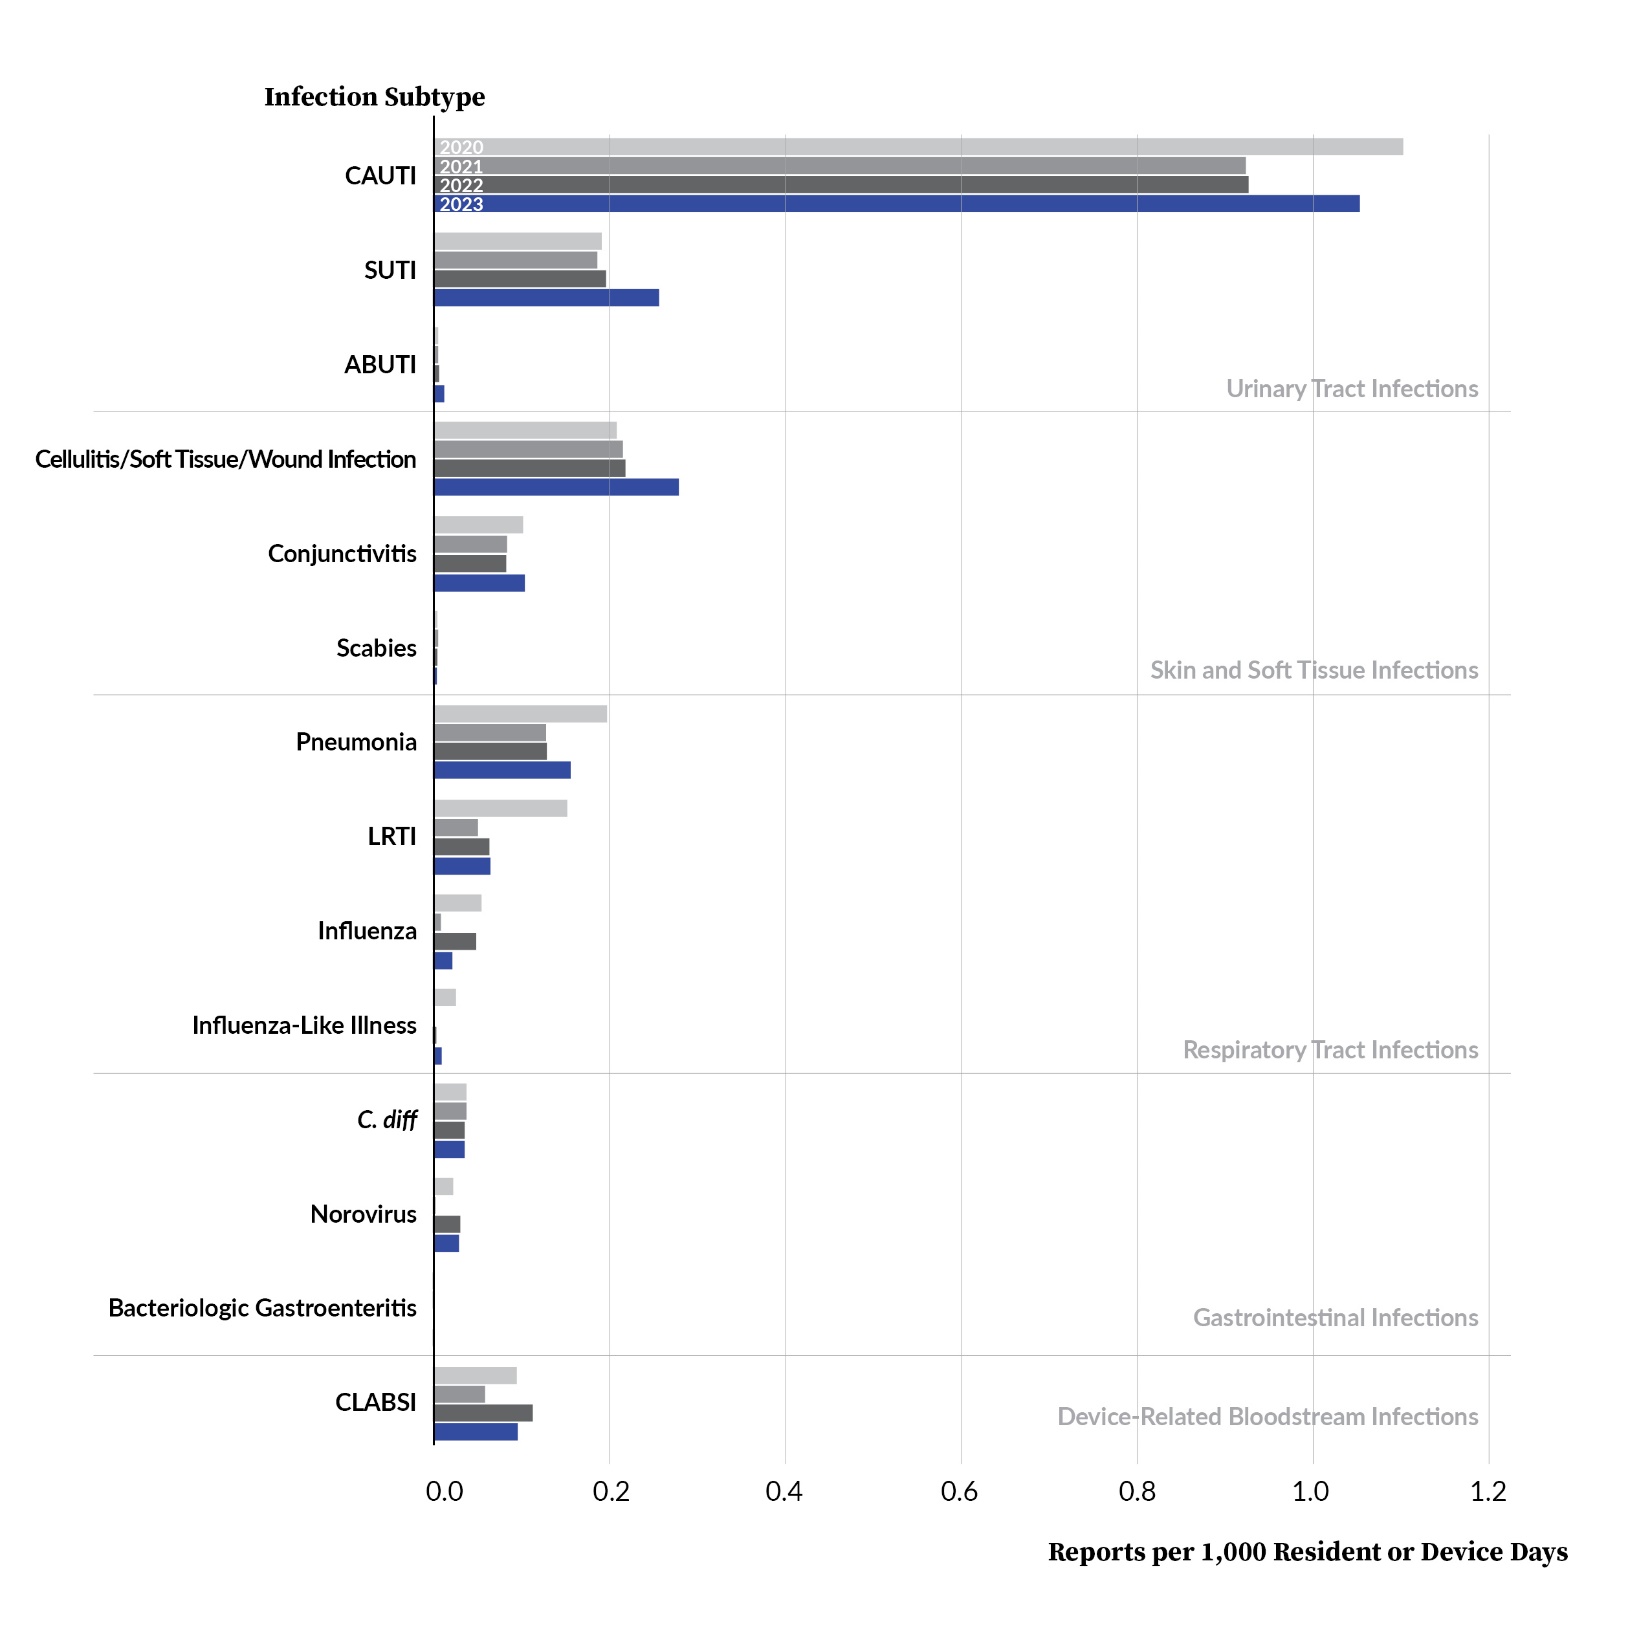
In Figure 6 and Table 5, rates are shown for each infection subtype for 2020 through 2023. As mentioned above, the UTI rate was a driver of the increase in the overall rate for 2023. Within the UTI infection type, there were notable increases in SUTI and catheter-associated urinary tract infection (CAUTI) rates, with SUTI increasing by 21.1% and CAUTI by 11.8%. Looking further into the circumstances around CAUTI, the past three years have seen a steady increase in the percentage of resident days that coincided with catheter usage. In the 10 years prior to 2021, this percentage varied from 4.5% to 4.8%; in 2021, 2022, and 2023, the percentage was 4.9%, 5.1%, and 5.3%, respectively.


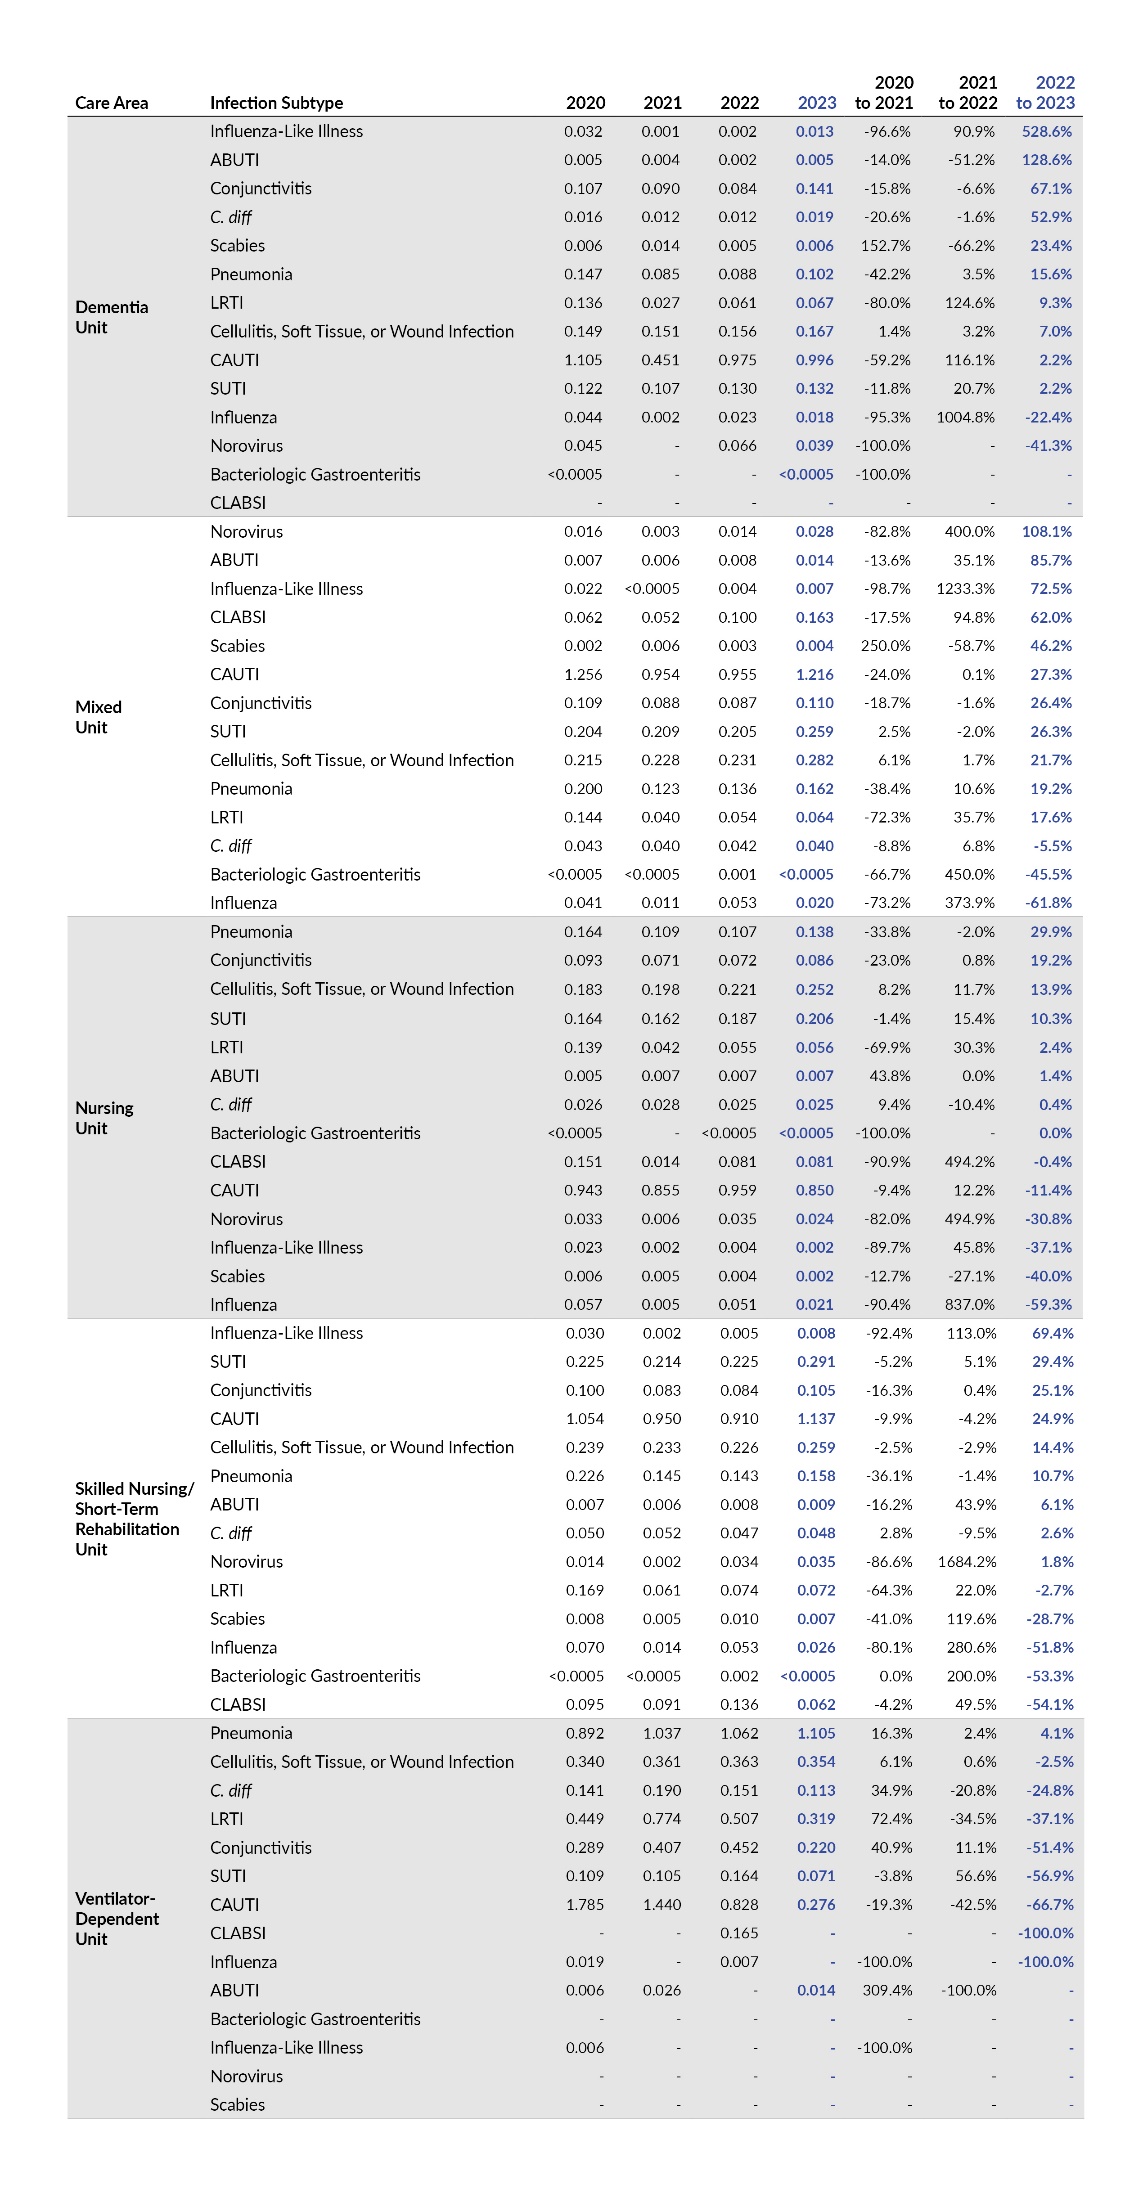
In Table 6, the infection rates are displayed by year based on care area and infection subtype. The largest percentage increases in rate from 2022 to 2023 occurred with influenza-like illness in dementia units (+528.6%), asymptomatic bacteremic urinary tract infection (ABUTI) in dementia units (+128.6%), and norovirus in mixed units (+108.1%). Influenza rates had the largest percentage decrease of all infection subtypes in three of the five care areas (mixed, nursing, and ventilator-dependent units).

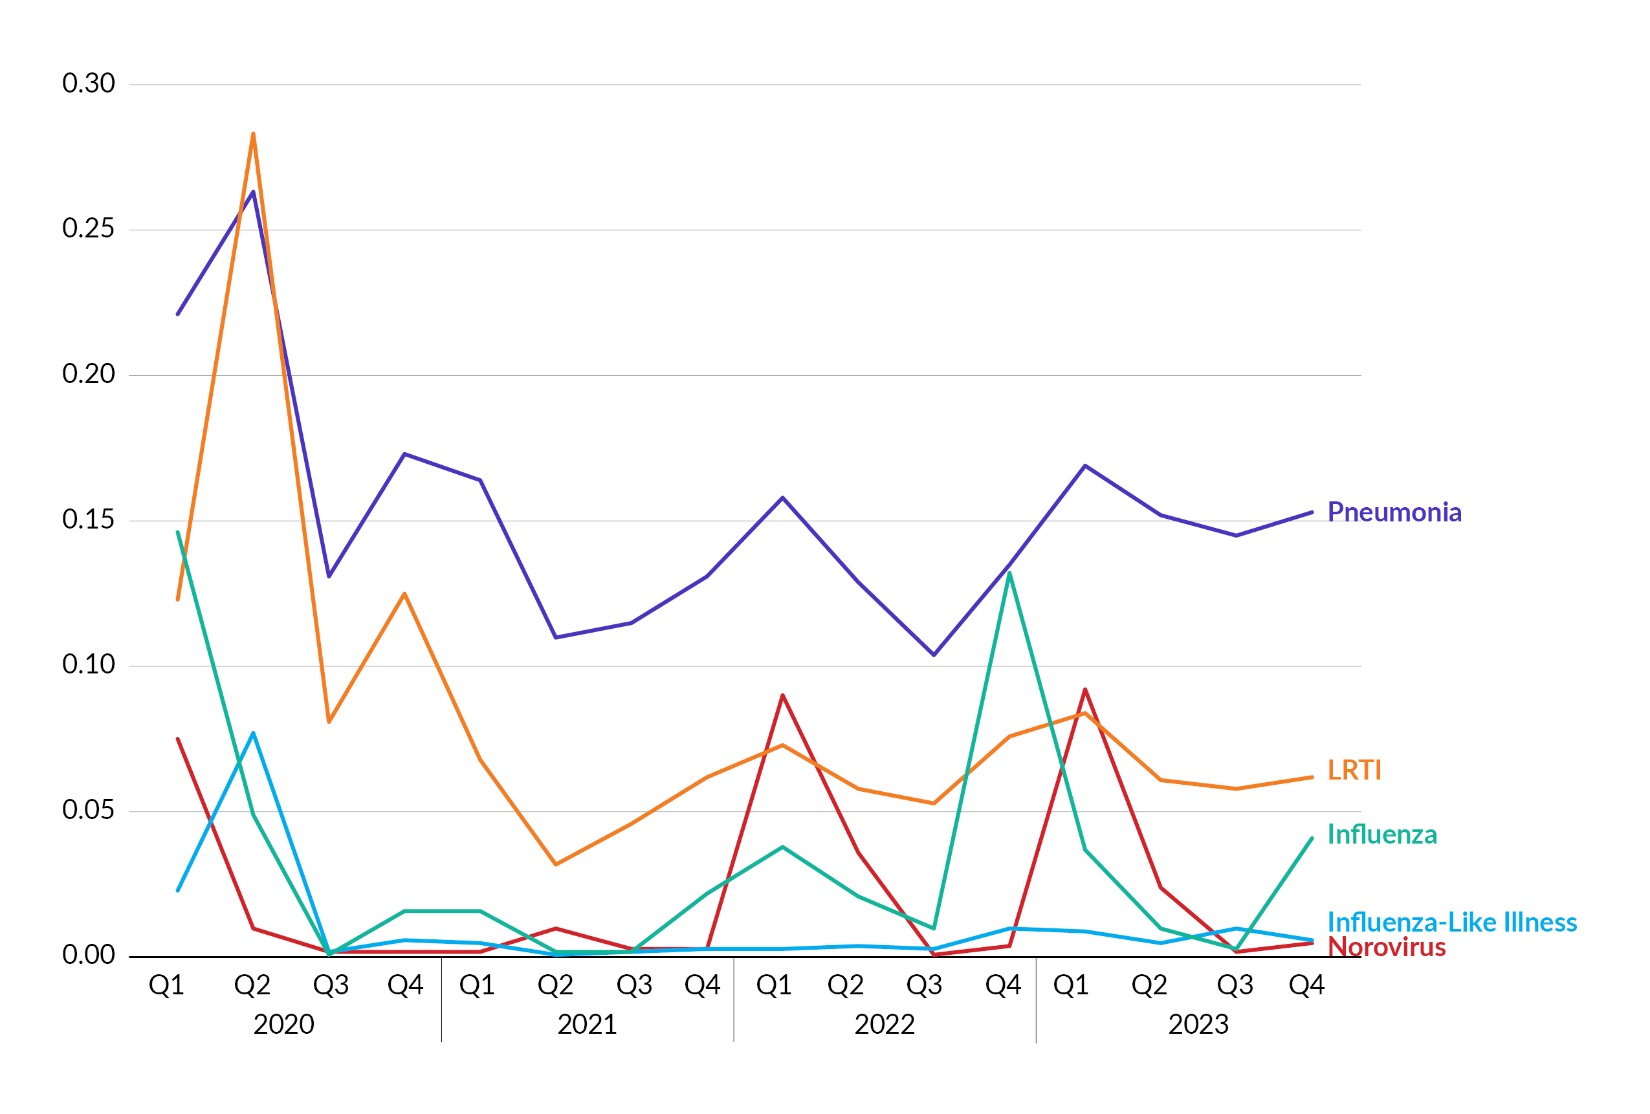
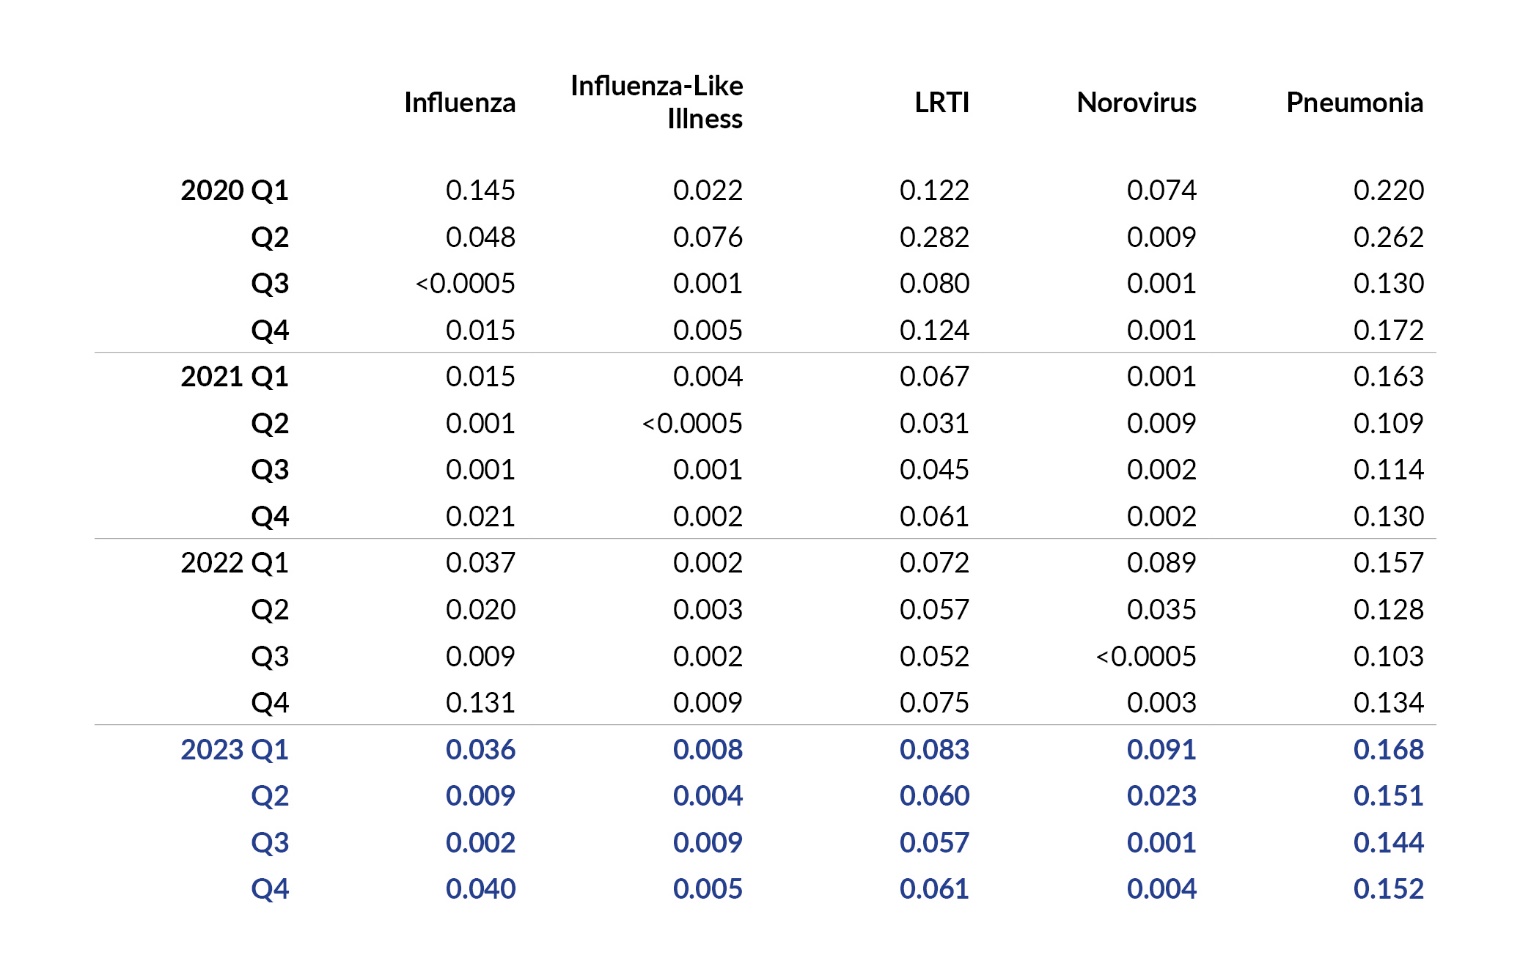
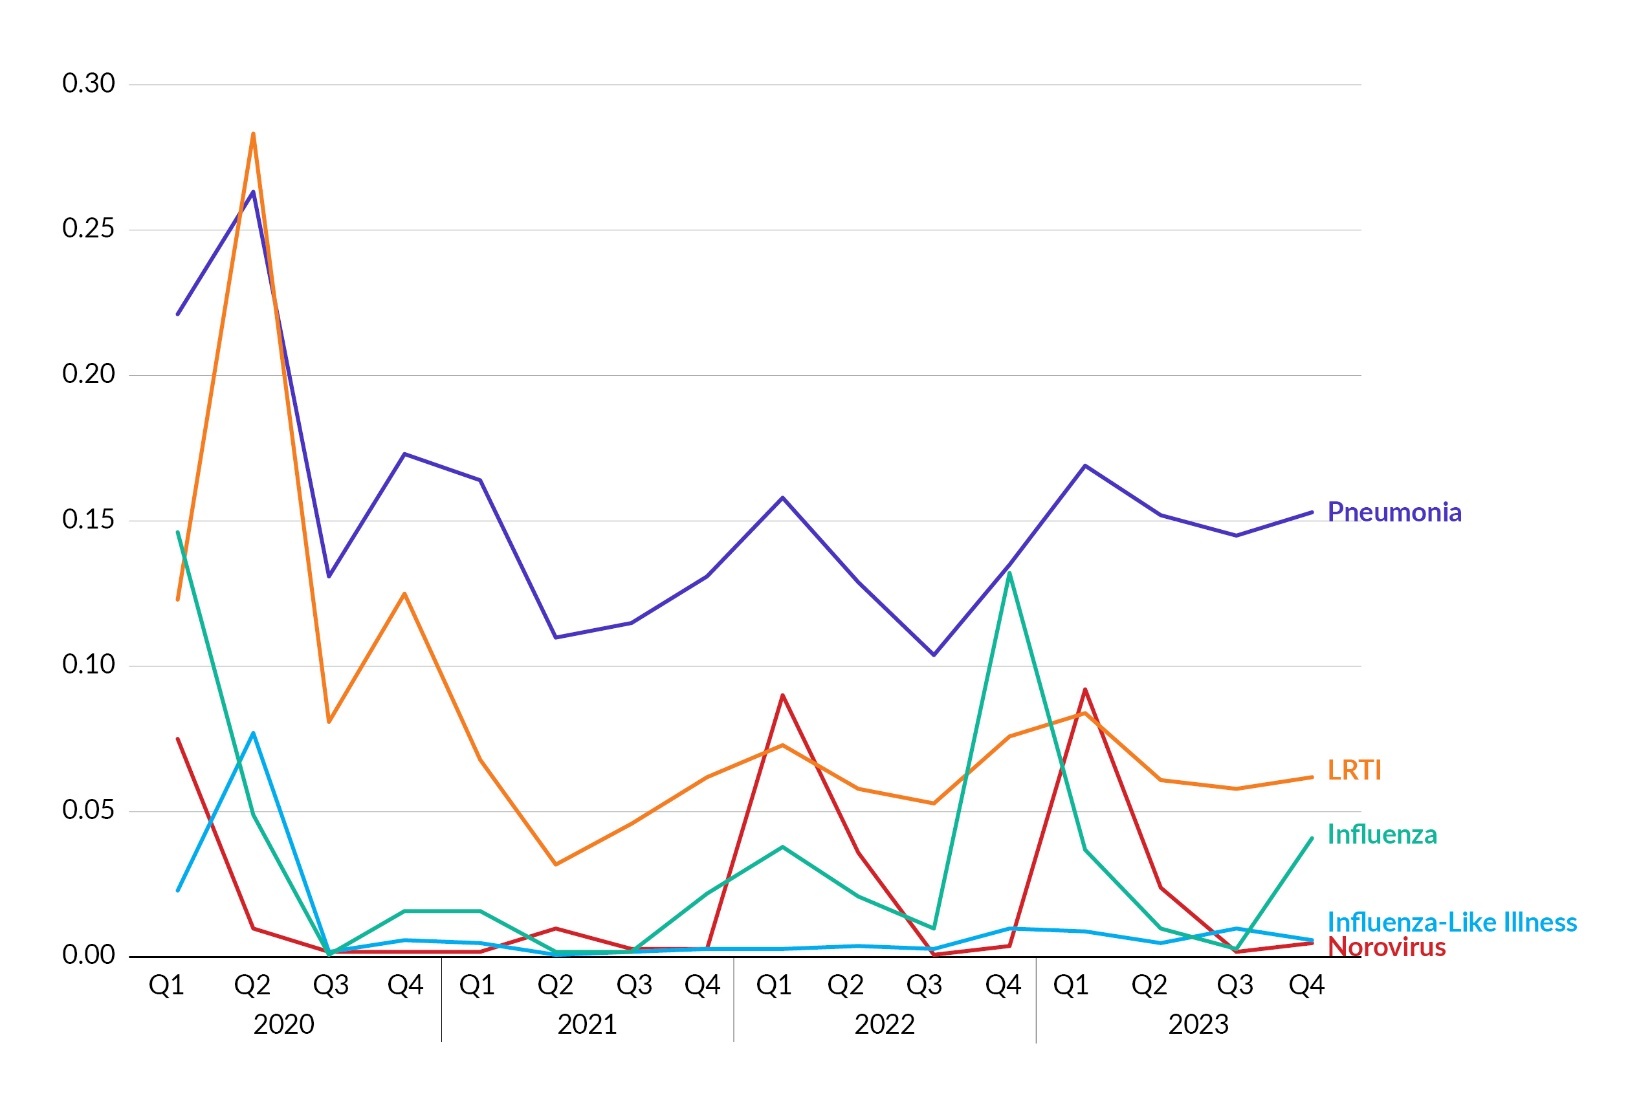
Figure 7 and Table 7 display infection rates for influenza, influenza-like illness, pneumonia, lower RTI (LRTI), and norovirus by quarter for 2020 through 2023. These rates are calculated as the number of infections by quarter per 1,000 resident days. With the exception of 2021, norovirus rates have peaked in Q1 of each year. The influenza rate rose to 0.04 in Q4 2023 after having been on a decline for three quarters following its peak in Q4 2022.

Discussion
Pennsylvania’s LTC facilities reported 23,970 infections and 24.0 million resident days in PA-PSRS in 2023, with an overall infection rate of 0.98. This represents an 18.6% increase in the total number of infection reports and an 11.4% increase in the rate of reported infections when compared to 2022. The increase in overall infection rate was driven by increases in UTI and SSTI rates, which increased by 20.1% and 17.4%, respectively.
Since the COVID-19 pandemic began, Patient Safety Authority (PSA) infection prevention advisors have noted that LTC facilities are challenged by infection preventionist turnover, creating scenarios with no overlap in on-site infection prevention coverage and a need for education on required reporting. In 2023, PSA identified facilities that did not report any HAIs or that were in the bottom 10th percentile of reporting in the previous year. PSA sent letters to these facilities advising that they may not be meeting reporting requirements. In addition, infection prevention advisors followed up with these facilities to discuss reporting requirements and provide guidance and resources for surveillance and reporting.
Conclusion
In 2023, there were increases in the number of infection reports submitted to PA-PSRS and the overall infection rate for Pennsylvania’s LTC facilities. The increase in overall infection rate was driven by UTI and SSTI, with notable increases in CAUTI and SUTI rates.
Note
This analysis was exempted from review by the Advarra Institutional Review Board.
Disclosure
The authors declare that they have no relevant or material financial interests.
About the Authors
Shawn Kepner (shawkepner@pa.gov) is a data scientist at the Patient Safety Authority.
Amanda Bennett is an infection prevention advisor at the Patient Safety Authority.
Rebecca Jones is director of Data Science & Research at the Patient Safety Authority (PSA) and founder and director of the PSA’s Center of Excellence for Improving Diagnosis.
PA-PSRS is a secure, web-based system through which Pennsylvania long-term care facilities submit reports of healthcare-associated infections in accordance with mandatory reporting laws outlined in the Medical Care Availability and Reduction of Error (MCARE) Act (Act 52 of 2007).1 All reports submitted through PA-PSRS are confidential and no information about individual facilities or providers is made public.