
Introduction
Accurate and timely diagnoses are essential for high-quality patient care.1 Diagnostic errors could harm patients physically and psychologically, and negatively affect healthcare providers.2–4 After the Institute of Medicine Committee on Quality of Health Care in America highlighted the prevalence of medical errors in the United States, various healthcare institutions developed and implemented interventions to prevent or reduce medical errors.5 For example, some healthcare institutions organized diagnostic management teams to assist physicians in selecting the appropriate clinical laboratory tests for their patients and interpreting the results correctly.1,6–8 Some healthcare institutions provided physicians with additional training focusing on the wise use of laboratory tests to prevent diagnostic errors caused by inappropriate use (underuse or overuse) of laboratory tests.9–11 Some healthcare institutions improved clinical laboratory services to provide timely reliable laboratory test results to support accurate diagnoses.12,13
Although previous interventions appeared promising at the time, recent studies suggest that diagnostic errors are still prevalent in the United States.3,14–16 Two studies analyzed the National Practitioner Data Bank (NPDB) dataset and reported that diagnosis-related errors accounted for a high percentage of medical malpractice allegations and payment, and over 70% of the diagnosis-related cases resulted in disability or death.4,15 A study by Aaronson et al. analyzed misdiagnosis-related malpractice claims and found that 46% of the 2,155 claims were associated with missed cancer diagnoses.14 Another study found that some diseases or conditions had a high diagnostic error rate (e.g., 62.1% for spinal abscess).3 Raffel et al. conducted an original research study involving 376 patients and found that diagnostic errors were associated with 5.6% of readmissions into a hospital within a week, in which the leading causes were failure to order necessary test(s) and incorrect interpretation of test results.16 Gunderson et al. conducted a systematic review and meta-analysis of studies reporting diagnostic incidents in adult inpatients and found that around 0.7% of hospital admissions were associated with diagnostic errors involving various diseases, which would be about 249,900 diagnostic errors in the United States every year based on the annual total hospital admissions.17
Methods
This study was a quantitative descriptive research study. A retrospective analysis of de-identified medical malpractice claims data included in the NPDB Public Use Data File downloaded from the NPDB website was performed to explore the characteristics and trends of medical diagnostic errors in the United States.18 The NPDB public use dataset included all the variables of interest for this study. This study included claims filed as Medical Malpractice Payments Reports in NPDB from 1999 to 2018 based on the year of act or omission. The information and definitions of the variables included in the NPDB dataset can be found in the reference provided by the NPDB.19
In this study, each payment amount was adjusted for inflation using the average consumer price index per year, standardized to 2022.15,20 IBM SPSS Statistics version 29.0 was used for data analysis. Descriptive statistics, including frequency distribution, were used to summarize and describe the data of selected variables. Chi-square tests were conducted to explore whether there was an association between two categorical variables. A normality test was conducted for the payment variable to determine whether the data was symmetrically distributed without skew. If the payment variable was not normally distributed, median and interquartile range (IQR), instead of mean and standard deviation, were used to describe the central tendency and variability of data for the payment variable. If the payment variable was not normally distributed, Mann-Whitney U tests, instead of t-tests, were conducted to explore whether payment amounts differed between two groups. An alpha level of 0.05 was used for all statistical tests, and p<0.05 was considered statistically significant. This study only used publicly available de-identified data included in the NPDB Public Use Data File. A.T. Still University Institutional Review Board approved this study as an exempt human research study (exempt protocol #2023-059).
Results
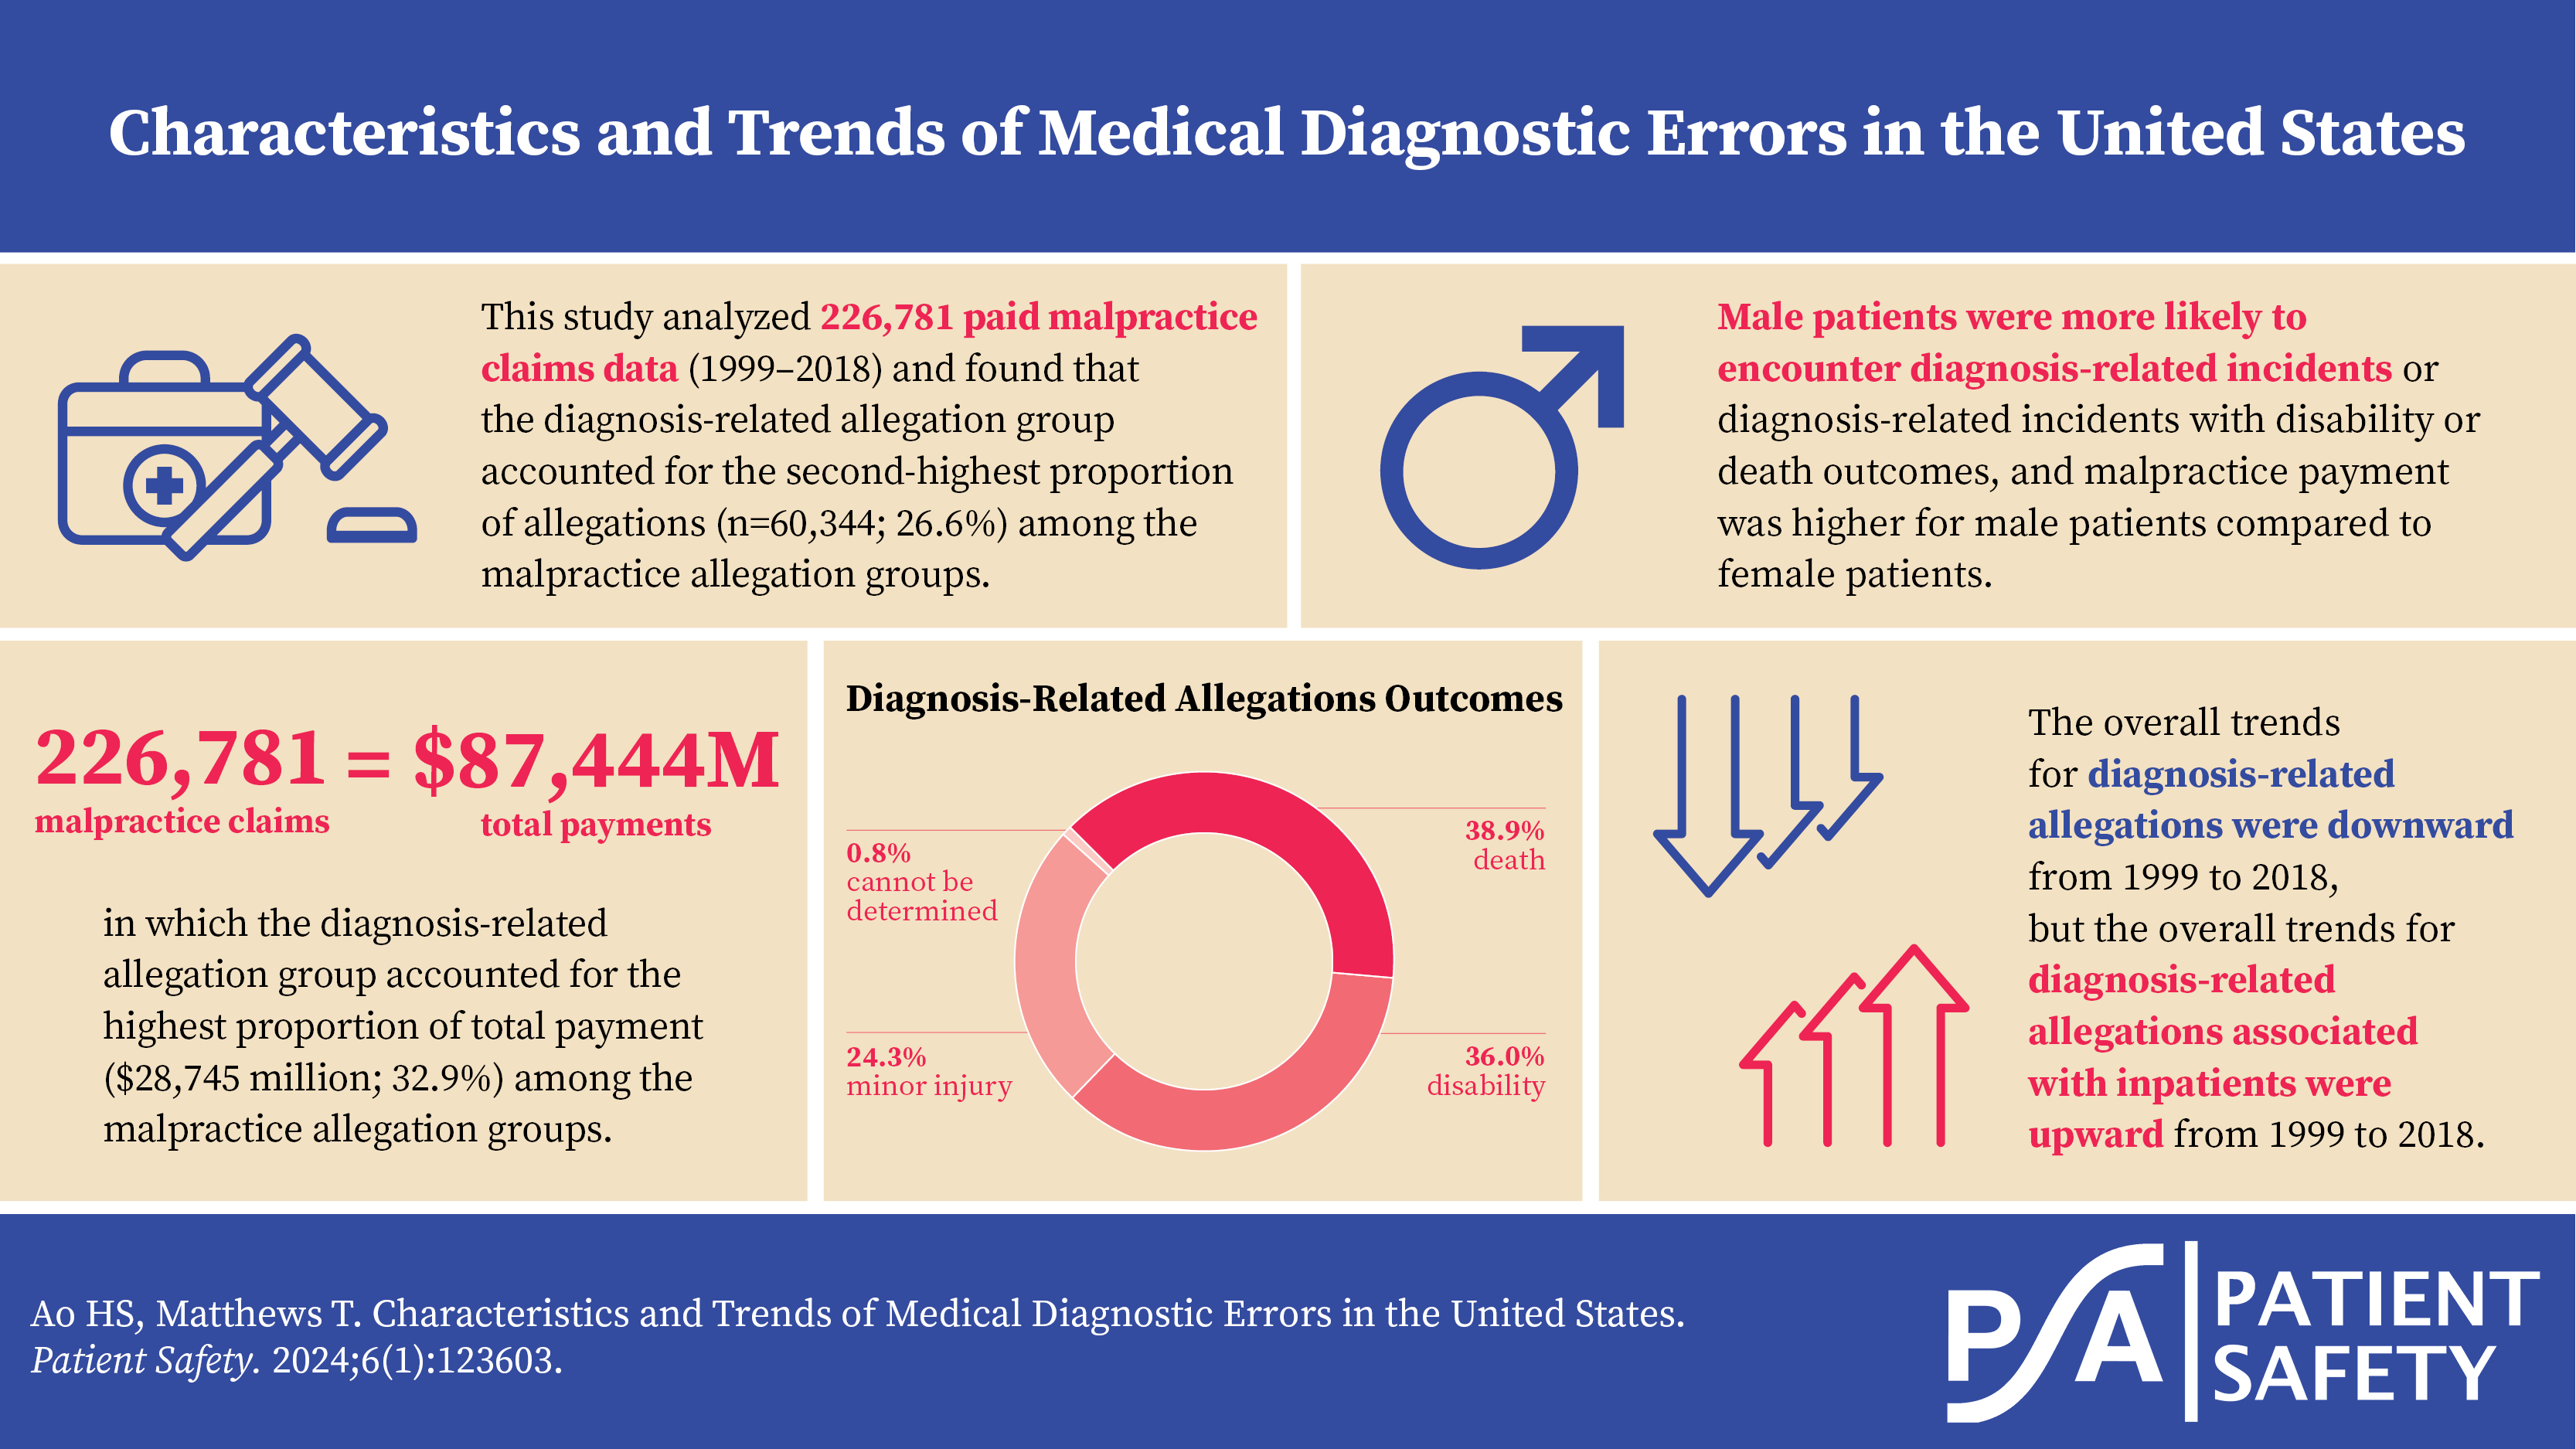
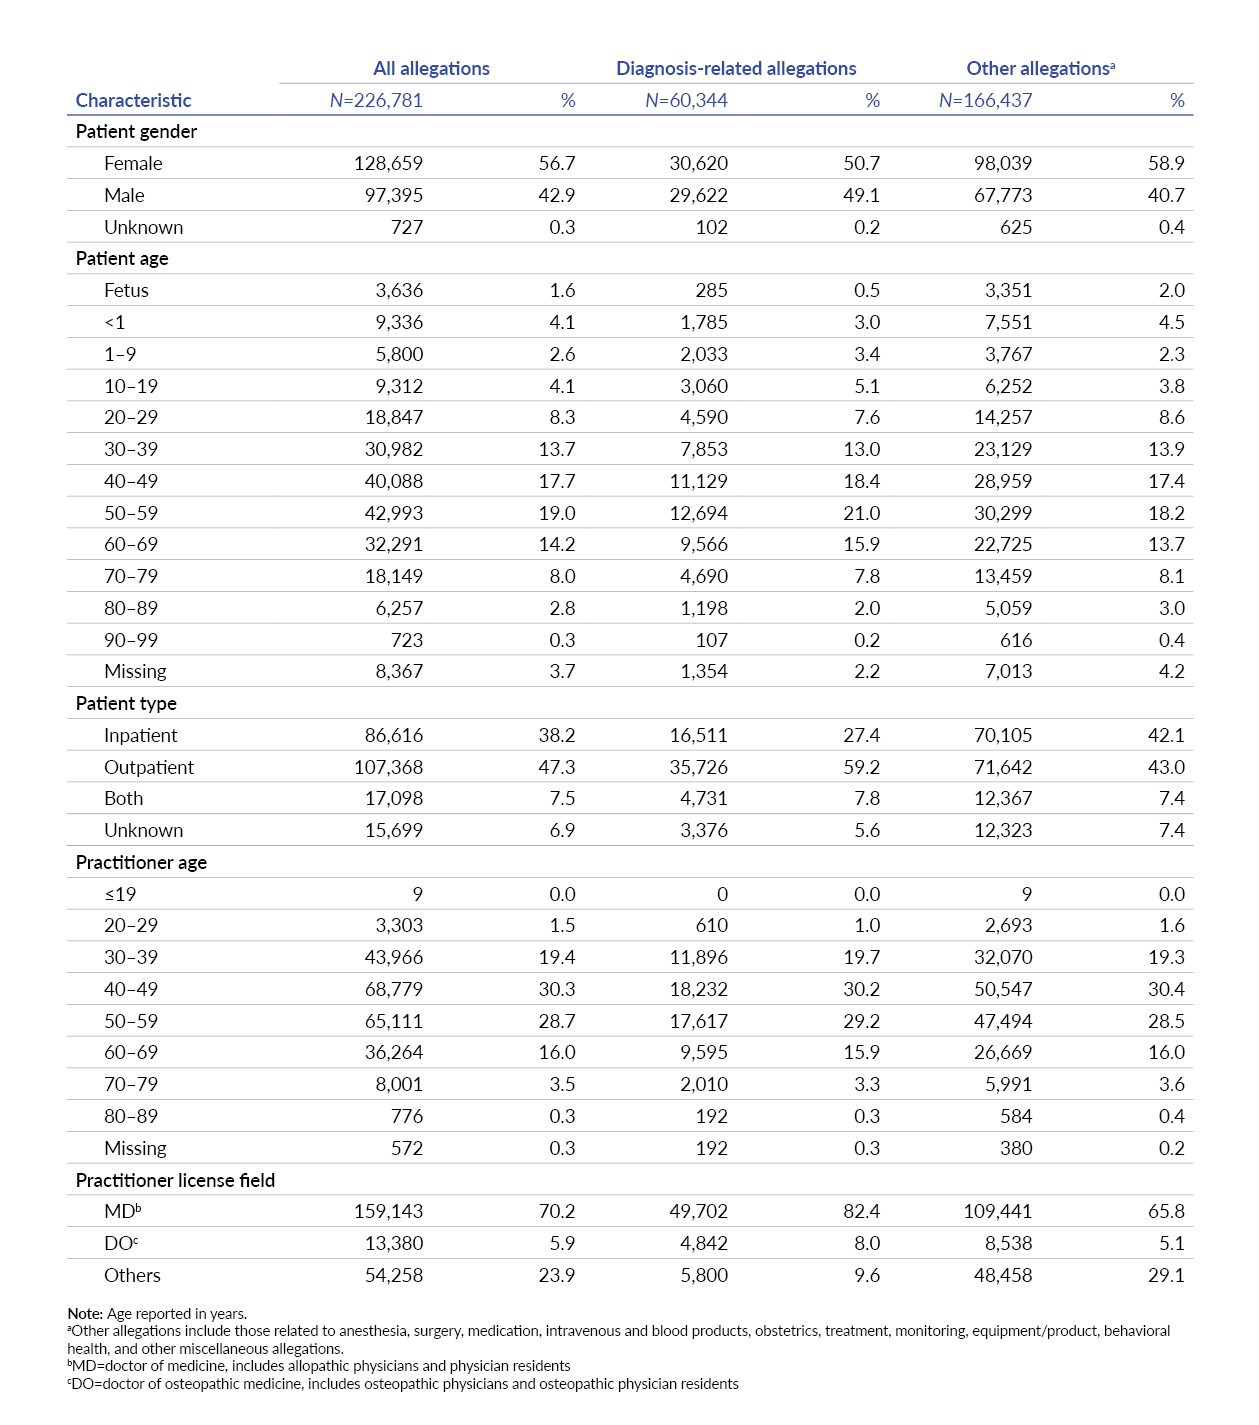
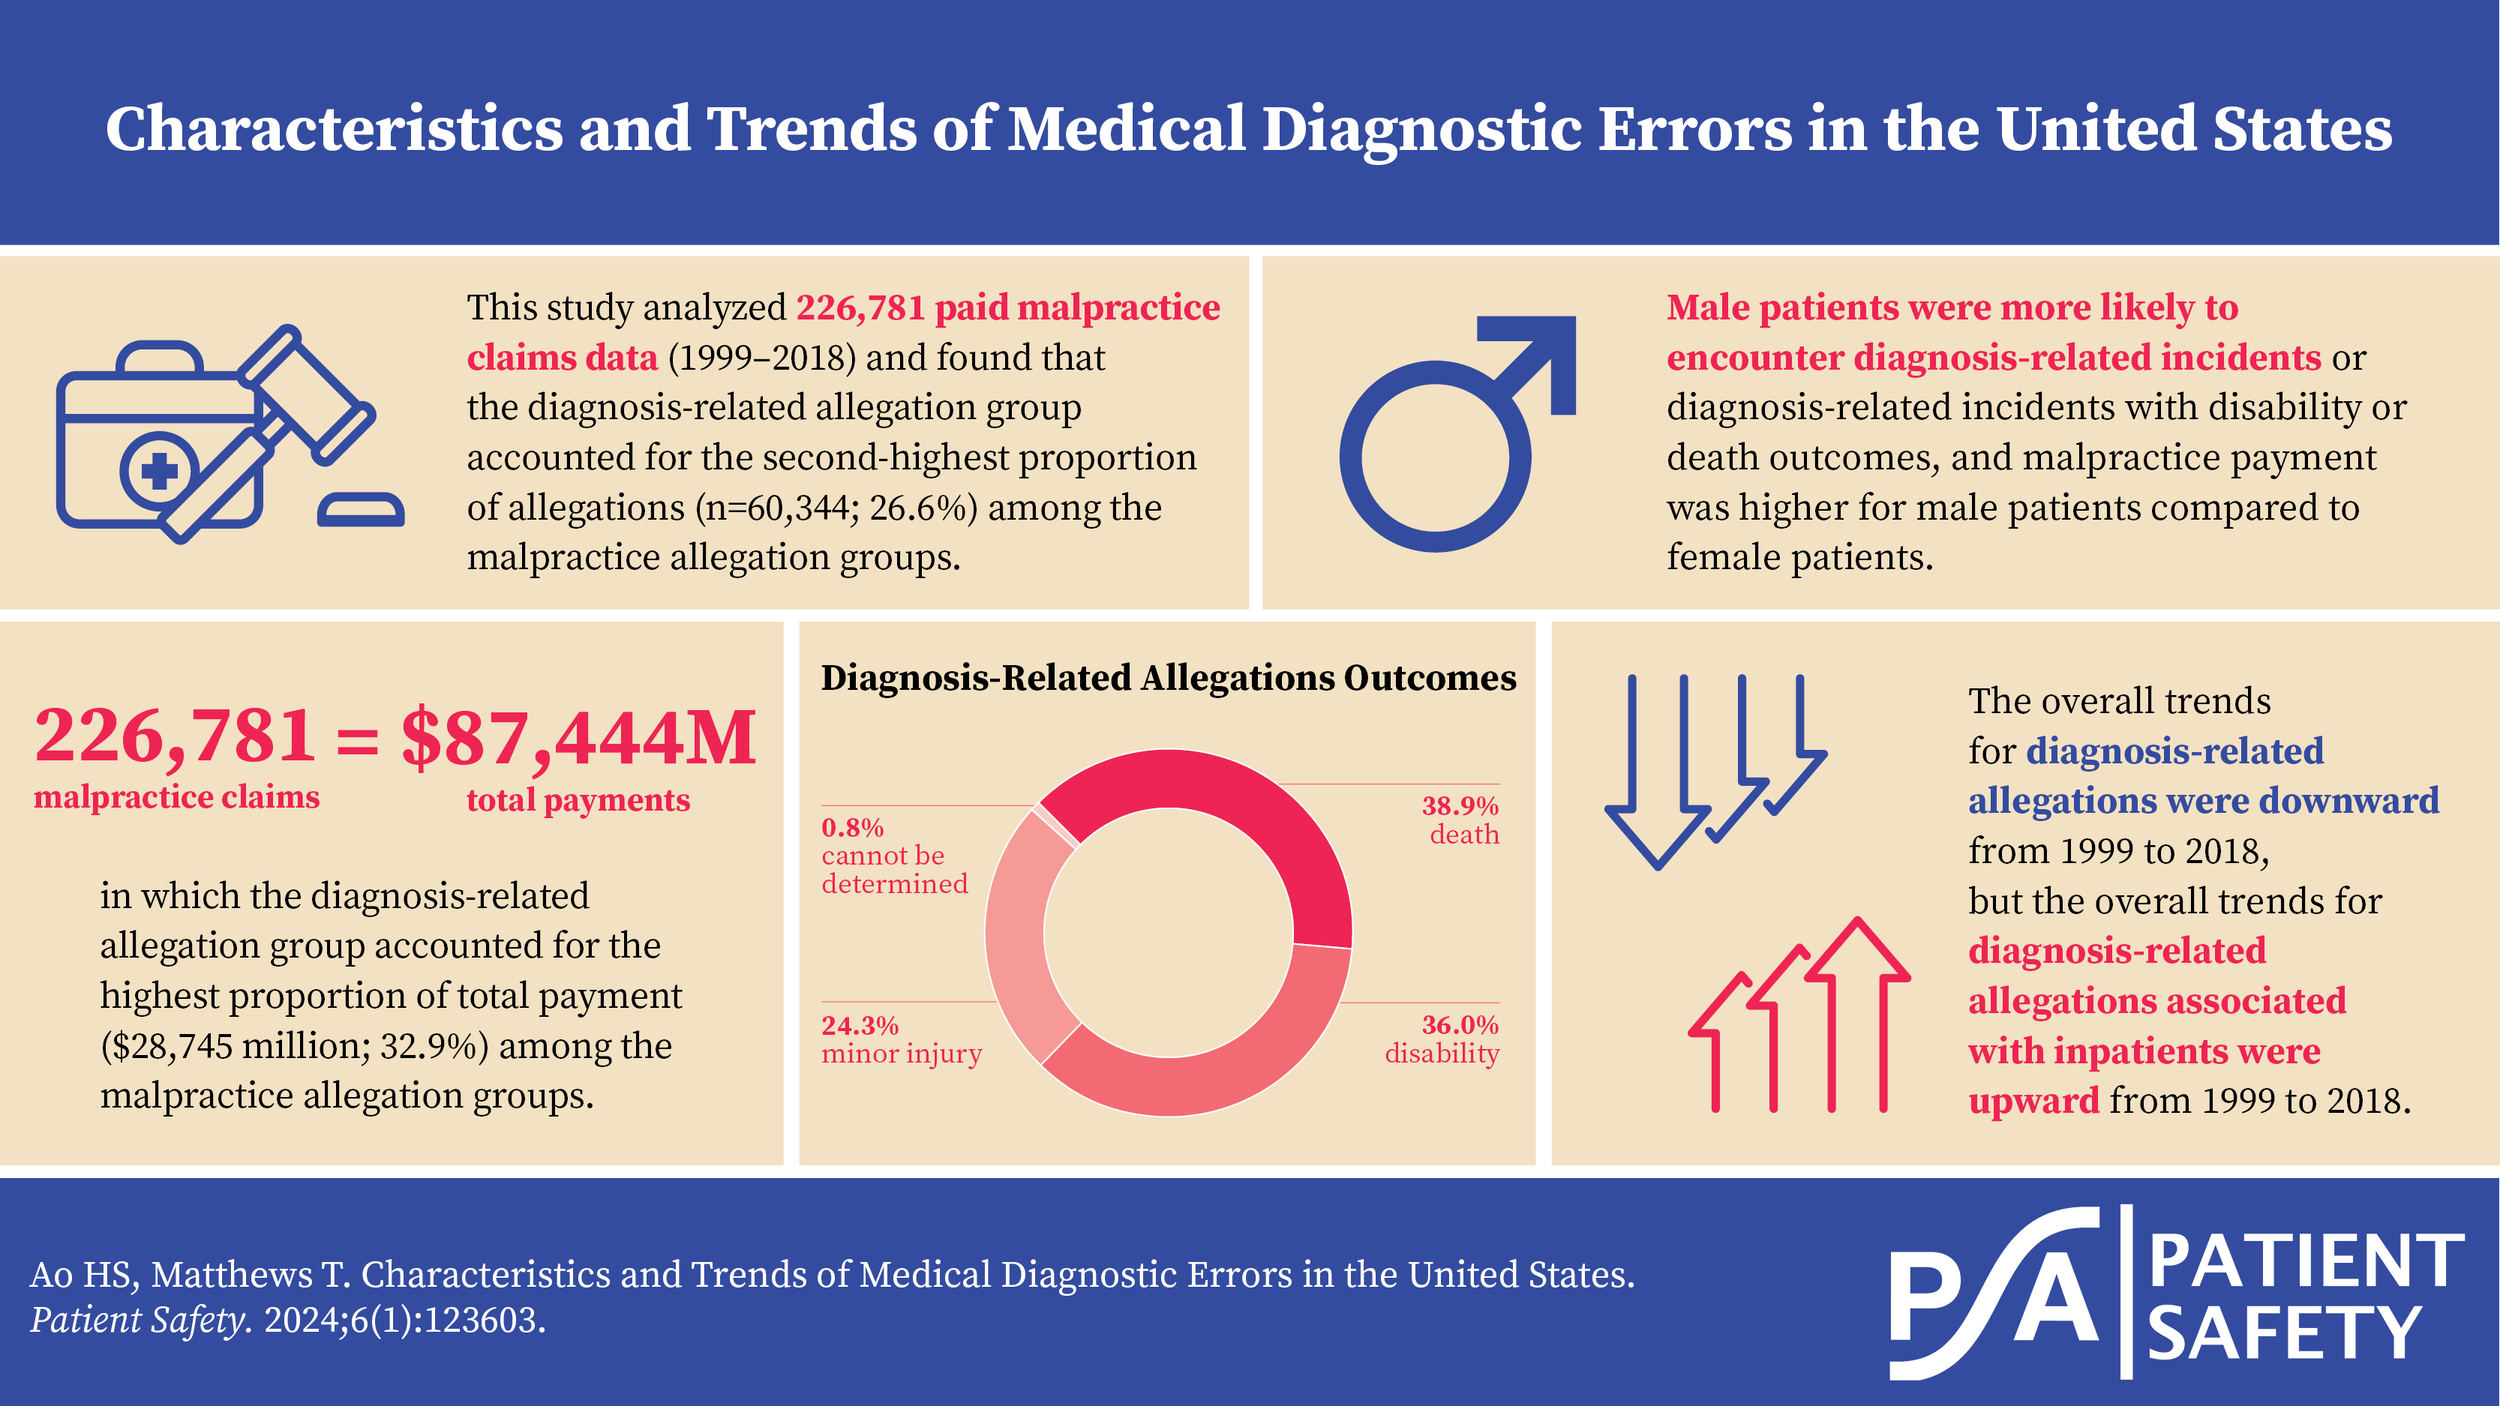
This study analyzed 226,781 paid malpractice claims with year of act or omission between 1999 and 2018 based on the NPDB dataset. Sample characteristics are summarized in Table 1. Of the 226,781 paid claims, 60,344 (26.6%) were diagnosis-related allegations. Female patients accounted for 50.7% of diagnosis-related allegations. Patients between 50 and 59 years old accounted for the highest percentage of paid claims, followed by patients in the 40–49 age group. Outpatients accounted for a higher percentage of diagnosis-related allegations than inpatients (59.2% outpatients, 27.4% inpatients). Practitioners in the 40–49 age group accounted for the highest percentage of the allegations (slightly over 30%), followed by practitioners in the 50–59 age group (about 29%). The doctor of medicine (MD) group accounted for the highest percentage of diagnosis-related allegations, which was 82.4%. The doctor of osteopathic medicine (DO) group accounted for 8.0% of diagnosis-related allegations, which was the second highest.
.jpg)
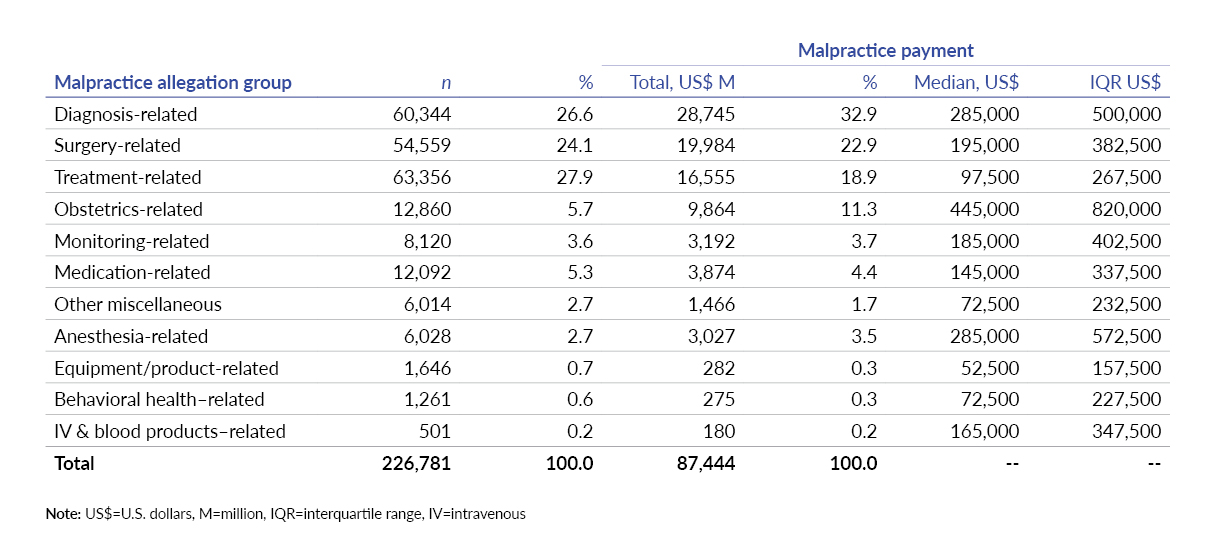
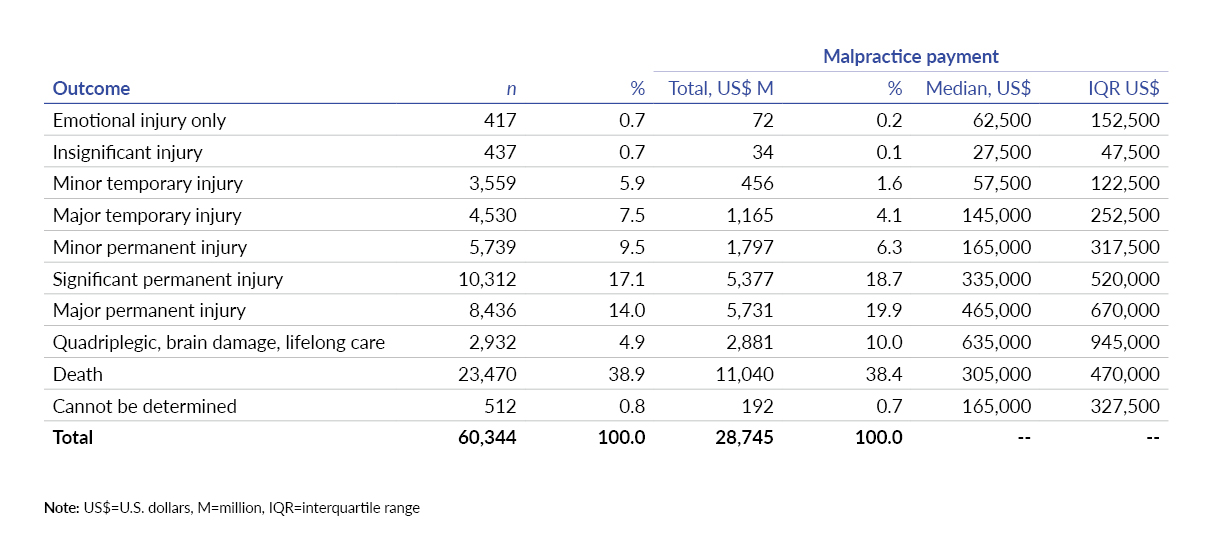
The distribution of malpractice allegations and payment by primary malpractice allegation group is summarized in Table 2. Diagnosis-related allegation group accounted for the second-highest proportion of allegations (26.6%) and the highest proportion of total payment (32.9%) among the malpractice allegation groups. The total amount of payment for diagnosis-related allegations was $28,745 million from 1999–2018, in which the median payment was $285,000. The distribution of outcome severity and payment of diagnosis-related allegations are summarized in Table 3. The outcome of 38.9% of the diagnosis-related allegations was death, and 36.0% was disability (17.1% was significant permanent injury; 14.0% was major permanent injury; 4.9% was quadriplegic, brain damage, lifelong care). While the quadriplegic, brain damage, lifelong care group accounted for 4.9% of the total allegations, it accounted for 10.0% of the total payment, and its median payment was the highest, which was $635,000.

.jpg)
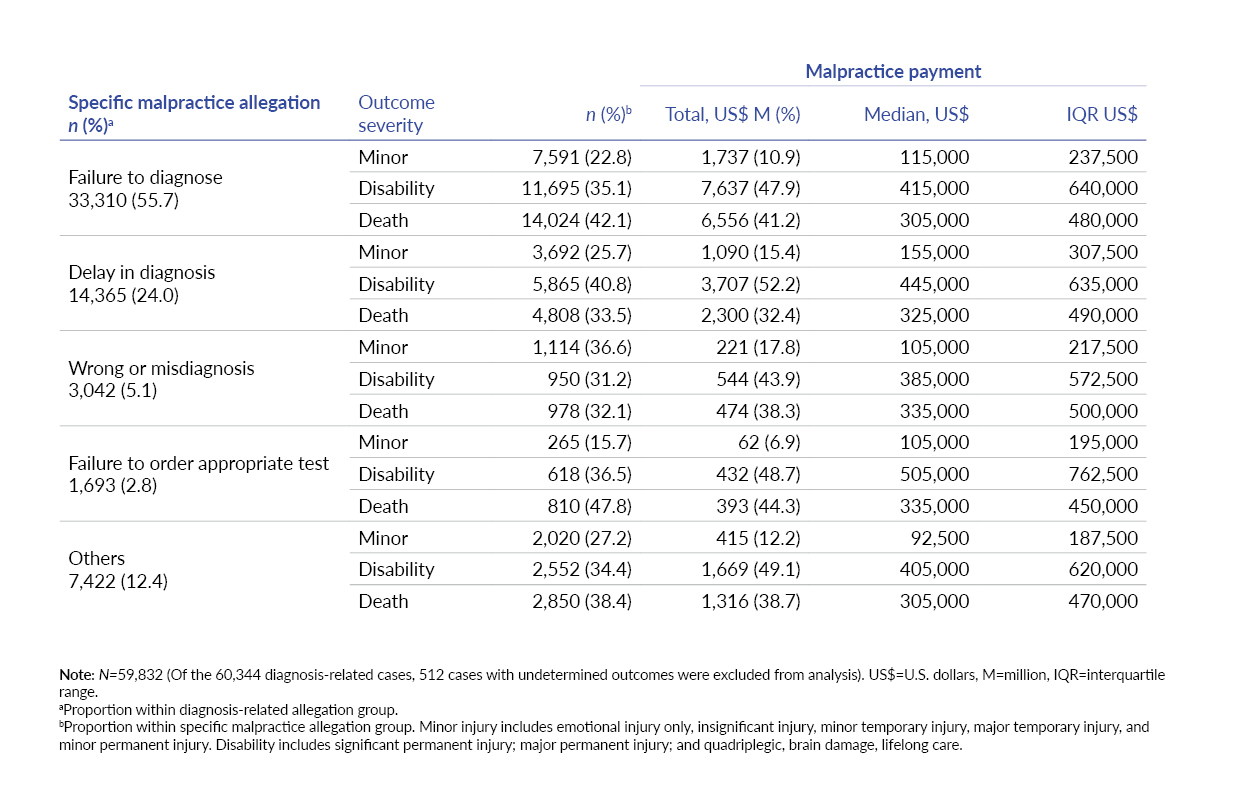
The distribution of outcome severity and payment of diagnosis-related allegations by specific malpractice allegation group are presented in Table 4. The leading specific malpractice allegations were failure to diagnose (55.7%), delay in diagnosis (24.0%), wrong or misdiagnosis (5.1%), and failure to order appropriate test (2.8%). Death and disability were the leading outcomes for diagnosis-related allegations associated with failure to diagnose, delay in diagnosis, or failure to order appropriate test. The outcome of 47.8% of diagnosis-related allegations associated with failure to order appropriate test was death, which was the highest among the four leading specific malpractice allegation groups. The total payment and median payment were highest for cases with disability outcome. The median payment was highest for the cases associated with failure to order appropriate test that resulted in disability, which was $505,000.

The results of chi-square tests exploring the association between sample characteristics and diagnosis-related allegations are presented in Table 5. There was a statistically significant association between patient gender and diagnosis-related allegations, χ2(1, N=226,054)=1,240.87, p<0.001. Male patients were more likely to encounter diagnosis-related incidents compared to female patients. There was a statistically significant association between patient age and diagnosis-related allegations, χ2(1, N=218,414)=120.48, p<0.001. Patients at or over 50 years old were more likely to encounter diagnosis-related incidents compared to patients below 50 years old. There was a statistically significant association between patient type and diagnosis-related allegations, χ2(1, N=193,984)=4,921.08, p<0.001. Outpatients were more likely to encounter diagnosis-related incidents compared to inpatients. There was no statistically significant association between practitioner age and diagnosis-related allegations, χ2(1, N=226,209)=1.37, p=0.241.

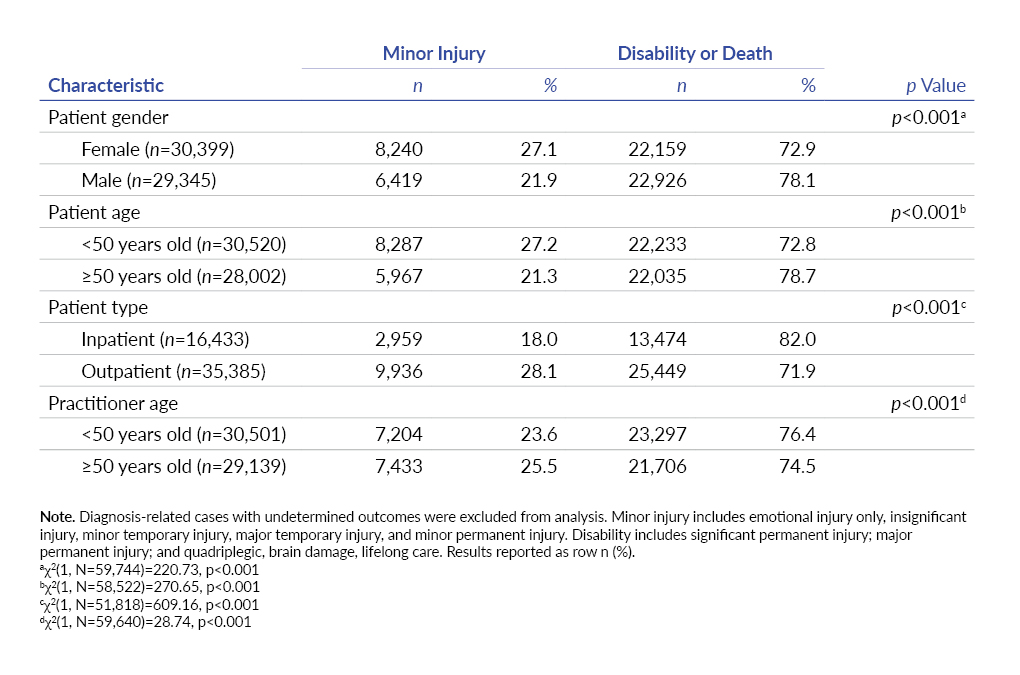
The results of chi-square tests for exploring association between sample characteristics and outcome severity of diagnosis-related allegations are presented in Table 6. There was a statistically significant association between patient gender and outcome severity, χ2(1, N=59,744)=220.73, p<0.001. Male patients were more likely to encounter diagnosis-related incidents that resulted in disability or death. There was a statistically significant association between patient age group and outcome severity, χ2(1, N=58,522)=270.65, p<0.001. Patients at or over 50 years old were more likely to encounter diagnosis-related incidents that resulted in disability or death. There was a statistically significant association between patient type and outcome severity, χ2(1, N=51,818)=609.16, p<0.001. Inpatients were more likely to encounter diagnosis-related incidents that resulted in disability or death. There was a statistically significant association between practitioner age group and outcome severity, χ2(1, N=59,640)=28.74, p<0.001. Practitioners below 50 years old were more likely to be involved in diagnosis-related incidents that resulted in disability or death.

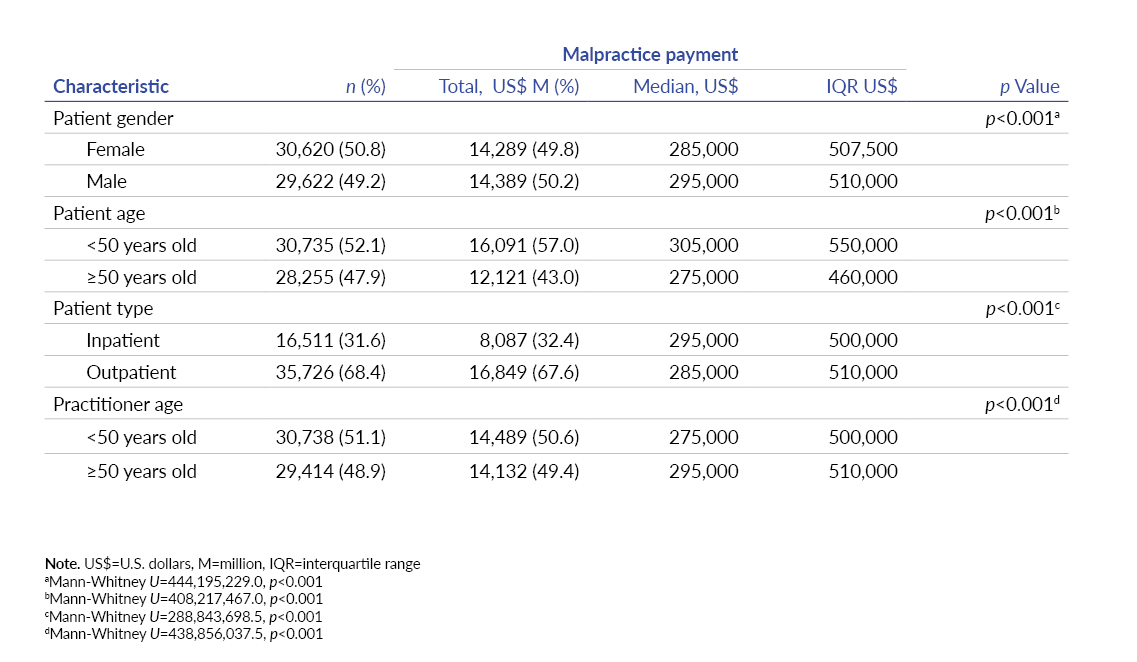
The results of Mann-Whitney U tests to examine whether there was a statistically significant difference in payment for diagnosis-related allegations between two compared groups are presented in Table 7. A Mann-Whitney U test indicated that payment was higher for male patients (median=$295,000) than for female patients (median=$285,000), U=444,195,229.0, p<0.001. A Mann-Whitney U test indicated that payment was higher for patients below 50 years old (median=$305,000) than for patients at or over 50 years old (median=$275,000), U=408,217,467.0, p<0.001. A Mann-Whitney U test indicated that payment was higher for inpatients (median=$295,000) than for outpatients (median=$285,000), U=288,843,698.5, p<0.001. A Mann-Whitney U test indicated that payment was higher for practitioners at or above 50 years old (median=$295,000) than for practitioners below 50 years old (median=$275,000), U=438,856,037.5, p<0.001.

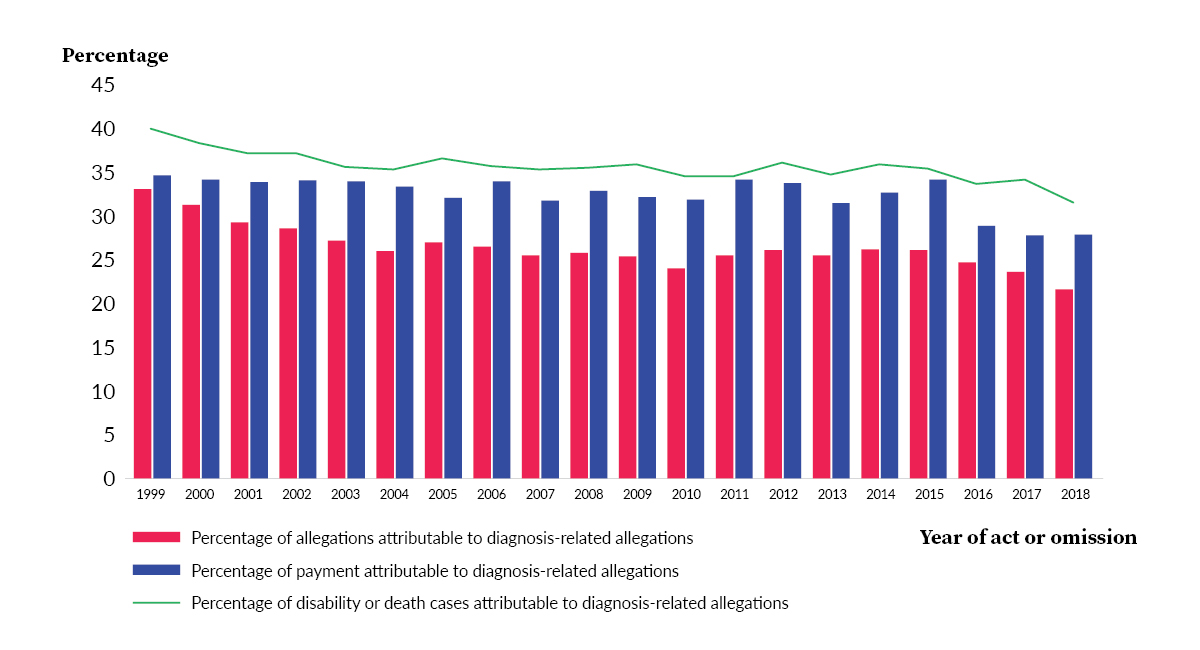
Trends for diagnosis-related allegations and payment are shown in Figure 1. The proportion of diagnosis-related allegations from 1999 to 2018 fluctuated but the overall trend was downwards: The highest percentage was 33.2% in 1999 and the lowest percentage was 21.7% in 2018, which was an 11.5% decrease. The proportion of payment attributable to diagnosis-related allegations from 1999 to 2018 fluctuated but the overall trend was downwards: The highest percentage was 34.8% in 1999 and it dropped to 28.0% in 2018, which was a 6.8% decrease. The proportion of disability or death cases attributable to diagnosis-related incidents from 1999 to 2018 fluctuated but the overall trend was downwards: The highest percentage was 40.3% in 1999 and the lowest percentage was 31.6% in 2018, which was an 8.7% decrease.

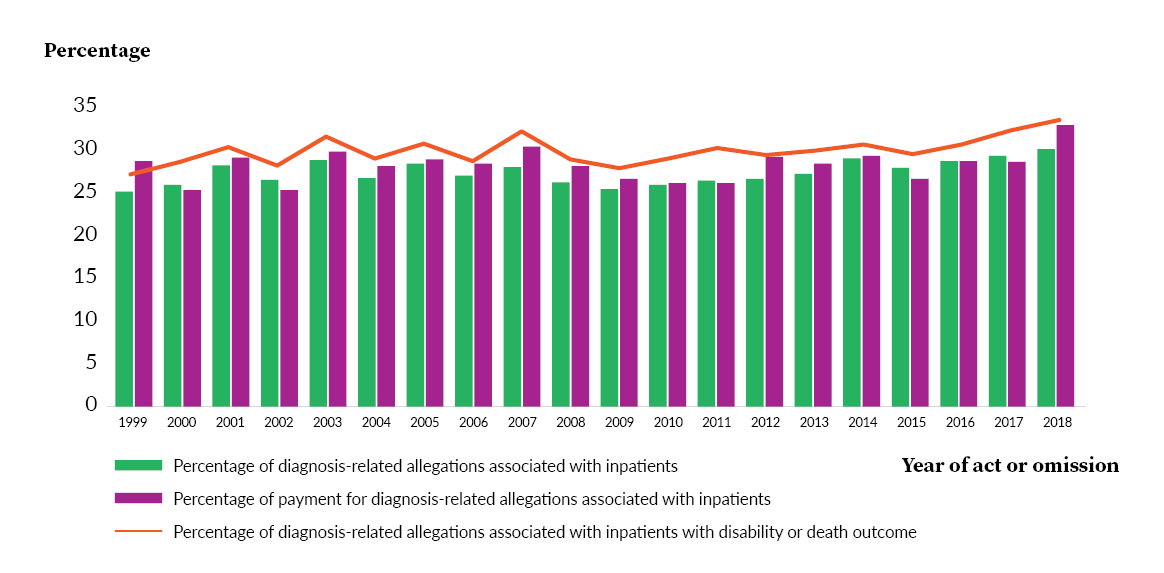
Trends for diagnosis-related allegations associated with inpatients are shown in Figure 2. The proportion of diagnosis-related allegations associated with inpatients from 1999 to 2018 fluctuated but the overall trend was upwards: The lowest percentage was 25.2% in 1999 and the highest percentage was 30.2% in 2018, which was a 5% increase. The proportion of payment for diagnosis-related allegations associated with inpatients from 1999 to 2018 fluctuated but the overall trend was upwards: The lowest percentage was 25.4% in 2000 and the highest percentage was 33.0% in 2018, which was a 7.6% increase. The proportion of diagnosis-related allegations associated with inpatients with disability or death outcome from 1999 to 2018 fluctuated but the overall trend was upwards: The lowest percentage was 27.3% in 1999 and the highest percentage was 33.5% in 2018, which was a 6.2% increase.

Discussion
The analysis of the NPDB malpractice claims data from 1999 to 2018 showed that the diagnosis-related allegation group accounted for 26.6% of all reported malpractice allegations, suggesting that diagnostic errors were prevalent in the United States. Besides, the results showed that the diagnosis-related allegation group accounted for the highest proportion of payment (32.9%), which was 14% and 10% higher than the treatment-related group and the surgery-related group, respectively. Moreover, the median payment for the diagnosis-related allegation group was $187,500 and $90,000 higher than the treatment-related group and the surgery-related group, respectively. The results suggested that diagnostic errors were costly. The results also showed that a high percentage of diagnosis-related allegations was associated with death or disability, suggesting that the harm from diagnostic errors could be serious and permanent. Male patients were more likely to encounter diagnosis-related incidents or diagnosis-related incidents with disability or death outcome, and malpractice payment was higher for male patients compared to female patients, suggesting that this could be an area for further research.
Although fluctuated, the overall trends for the proportion of diagnosis-related allegations were downwards. Further studies focusing on identifying the contributing factors for the downward trends would provide valuable information for guiding intervention efforts. On the other hand, this study found that while outpatients were more likely to encounter diagnosis-related incidents, inpatients were more likely to experience diagnosis-related incidents that resulted in disability/death or higher payment. This study also found the overall trends for diagnosis-related allegations associated with inpatients from 1999 to 2018 were upwards. The inpatient setting and outpatient setting might encounter different challenges and obstacles in obtaining timely and accurate diagnoses, such as time pressure and communication barriers between diagnostic team members.1,15,21 Future studies focusing on identifying the specific challenges and obstacles would provide valuable information for preventing and reducing diagnostic errors in various clinical settings.
Moreover, the analysis results of this study showed that MDs and DOs were related to 82.4% and 8.0% of diagnosis-related allegations from 1999 to 2018, respectively, suggesting that the majority of diagnosis-related allegations involved physicians. The leading specific malpractice allegations were failure to diagnose, delay in diagnosis, wrong or misdiagnosis, and failure to order appropriate test. Ordering the appropriate diagnostic tests for patients and interpreting the test results correctly are critical for supporting timely and accurate diagnoses.22 However, previous studies found that ordering laboratory tests and interpreting test results accurately could be challenging for physicians.7,23 As such, identifying practical approaches for assisting physicians in ordering appropriate diagnostic tests and interpreting test results correctly could be a promising strategy for reducing diagnostic errors.7 Future studies evaluating the effectiveness of potential approaches would be valuable.
This study has several limitations. Underestimation of diagnosis-related errors was possible because not all incidents were required to be reported to the NPDB. For example, a claim not involving an individual practitioner or a claim not involving monetary payment was not required to be reported.24 A malpractice claim paid by a practitioner out of their pocket was also not required to be reported.24 Besides, underestimation of diagnosis-related errors associated with minor harm was possible because only incidents with a written request for monetary payment were required to be reported.24 Overestimation of the proportion of diagnosis-related errors associated with more severe injuries would be possible if there was a tendency to include more of those cases in the NPDB dataset due to the reporting requirements.15,24 In addition, inaccurate estimation of proportion of diagnosis-related errors was possible because not all paid claims were associated with professional incompetency or medical errors.24 Despite the limitations, the analysis of a large set of national medical malpractice data collected over the years could provide useful information for exploring the characteristics and trends of diagnosis-related errors.
Conclusion
This study suggests that diagnosis-related incidents frequently happen in different healthcare settings in the United States. While the downward trends are encouraging, the high proportions of diagnosis-related allegations and the increasing trends for cases associated with inpatients are alarming. Further research focused on identifying the root causes of diagnostic errors, the contributing factors for the upward or downward trends, and the effective corrective actions and interventions would provide valuable information for reducing preventable diagnostic errors and improving patient safety.
Disclosure
The authors declare that they have no relevant or material financial interests.
About the Authors
Hei Sio Ao (sa204785@atsu.edu) has been awarded a doctor of health sciences degree and a certificate for academic excellence from A.T. Still University. She is an American Society for Clinical Pathology–certified technologist in molecular biology. She has worked in the laboratory science and health science fields.
Tracy Matthews is a committed faculty member at A.T. Still University, where she plays an integral role in advancing healthcare education and research. In addition to her academic background, she is currently pursuing a law degree, set to be completed in 2025, which will expand her expertise into healthcare law and enhance her professional impact.