


Introduction
Pennsylvania is the only state that requires healthcare facilities to report all events that cause harm or have the potential to cause harm to a patient. These patient safety events are reported to the Pennsylvania Patient Safety Reporting System (PA-PSRS)[1], which is the largest patient safety data repository of its kind in the United States and one of the largest globally, housing over 5 million reports submitted since 2004.
In this article, we present data from reports submitted to PA-PSRS in 2024 and offer comparisons and insights to highlight potential areas for patient safety improvement.
Definitions
While many terms are commonly used interchangeably to describe the occurrence and severity of patient safety events, in the context of this manuscript they hold distinct meanings and indications for reporting to PA-PSRS under the Medical Care Availability and Reduction of Error (MCARE) Act (Act 13 of 2002).1 As defined in MCARE, an “incident” is “an event, occurrence, or situation involving the clinical care of a patient in a medical facility which could have injured the patient but did not either cause an unanticipated injury or require the delivery of additional healthcare services to the patient”1 and a “serious event” is “an event, occurrence, or situation involving the clinical care of a patient in a medical facility that results in death or compromises patient safety and results in an unanticipated injury requiring the delivery of additional healthcare services to the patient.”1
Each event report includes a harm score, assigned by the reporting facility, which indicates the potential or actual harm to the patient resulting from the event. Table 1 provides the definitions for each harm score, as well as the groupings for incidents, serious events, and high harm events.

Methods
This analysis was conducted using data extracted from PA-PSRS on February 1, 2025, along with data from the Pennsylvania Health Care Cost Containment Council (PHC4)[2]. Report counts are based on the date the report was submitted, while reporting rates are calculated using the event occurrence date. Rates are expressed per 1,000 patient days for hospitals and per 1,000 surgical encounters for ambulatory surgical facilities (ASFs). The event occurrence date is used for rate calculations to maintain consistency with the time frame of patient days or surgical encounters. At the time of this analysis, PHC4 data was available through Q2 2024, allowing for the calculation of 2024 rates using the first two quarters of PA-PSRS data.
Results
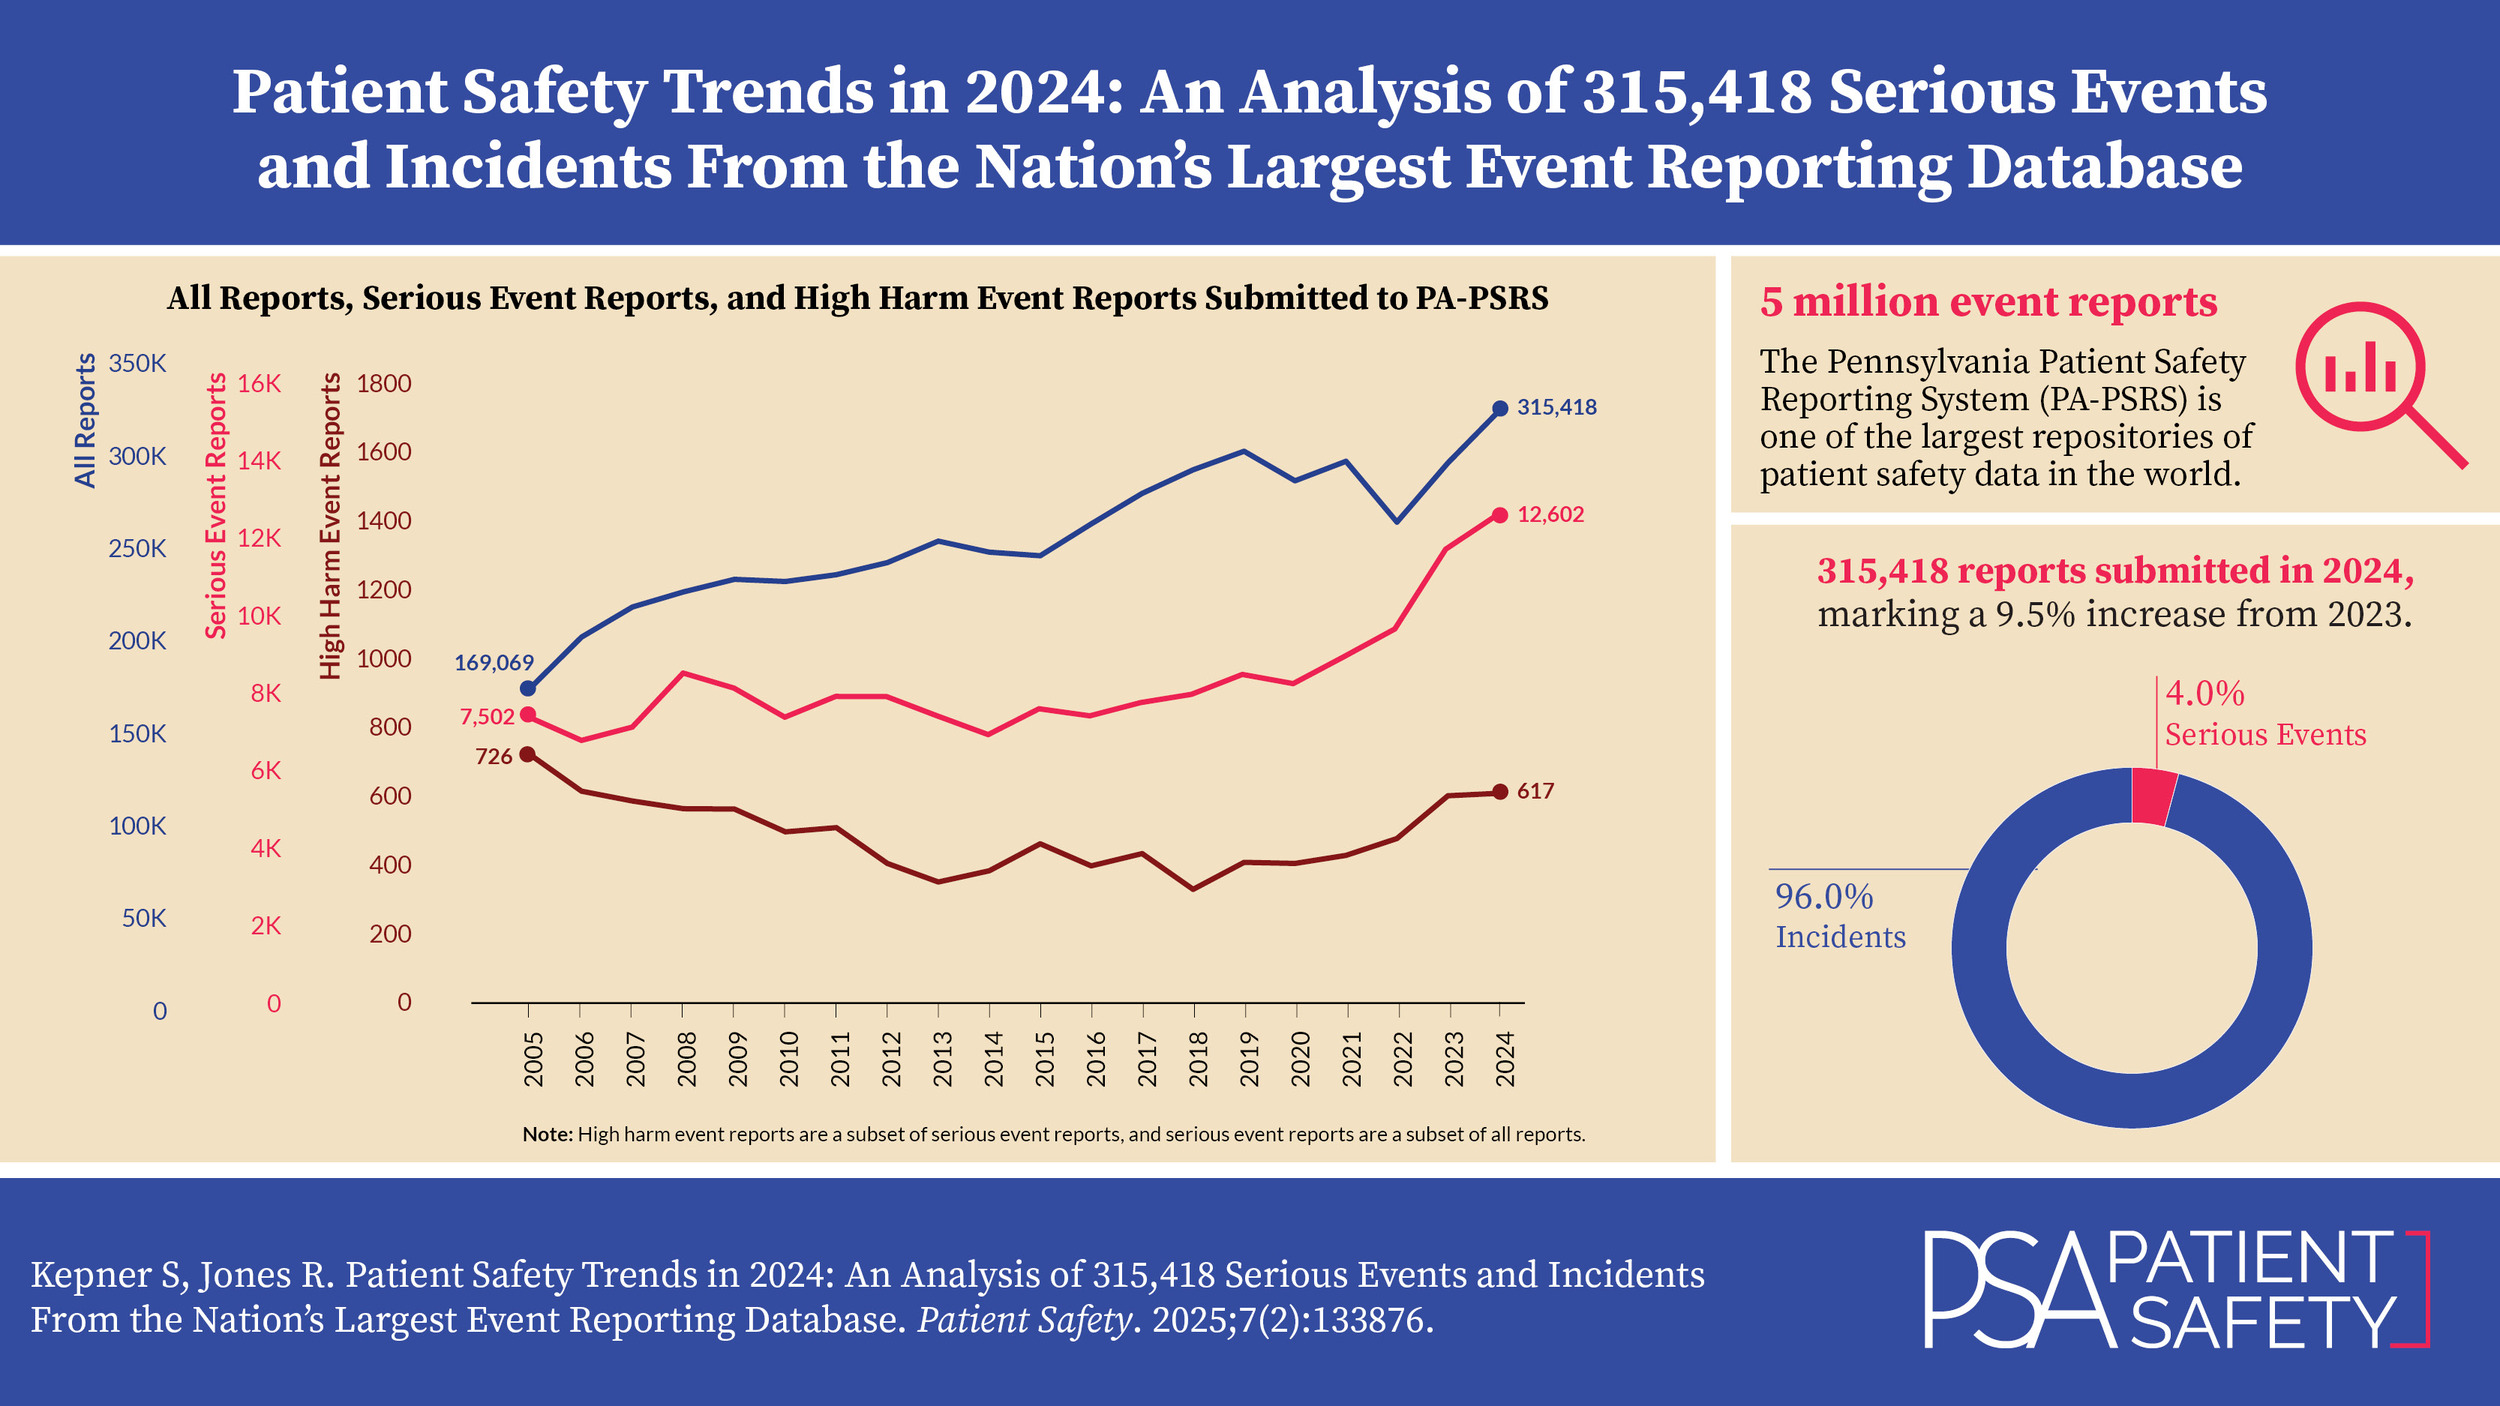
As shown in Figure 1, 315,418 reports were submitted in 2024, marking a 9.5% increase (27,424 reports) compared to 2023. This is the second largest percentage increase since 2006, following the highest increase in 2023. Of the 315,418 reports in 2024, 12,602 were classified as serious events, 617 of which were high harm. The number of serious and high harm event reports increased from 2023 by 7.3% and 1.1%, respectively. Figure 2 illustrates the proportion of incidents and serious events within all reports. In 2024, 4.0% of reports were classified as serious events, the second highest percentage since the first full year of PA-PSRS reporting in 2005.


Table 2 shows a breakdown of incidents and serious events by facility type from the past three years. From 2023 to 2024, the number of reports submitted by hospitals increased by 26,321 (9.5%), and reports from nonhospital facilities (i.e., ASFs, birthing centers [BRCs], and abortion facilities [ABFs]) increased by 1,103 (9.5%).

Table 3 displays harm score distributions for reports submitted from 2022 to 2024. While harm score C remained the most common classification in 2024, harm score D showed the largest increase in number. Serious events accounted for 4.0% of all reports submitted in 2024, with harm scores E and F being reported most frequently. The largest percentage increase was observed with harm score B1, which rose by 45.9%. A closer examination of the B1 reports indicates that this increase was predominated by a few specific facilities rather than representing a widespread pattern across the state.

Reporting Rates Based on Event Occurrence Date
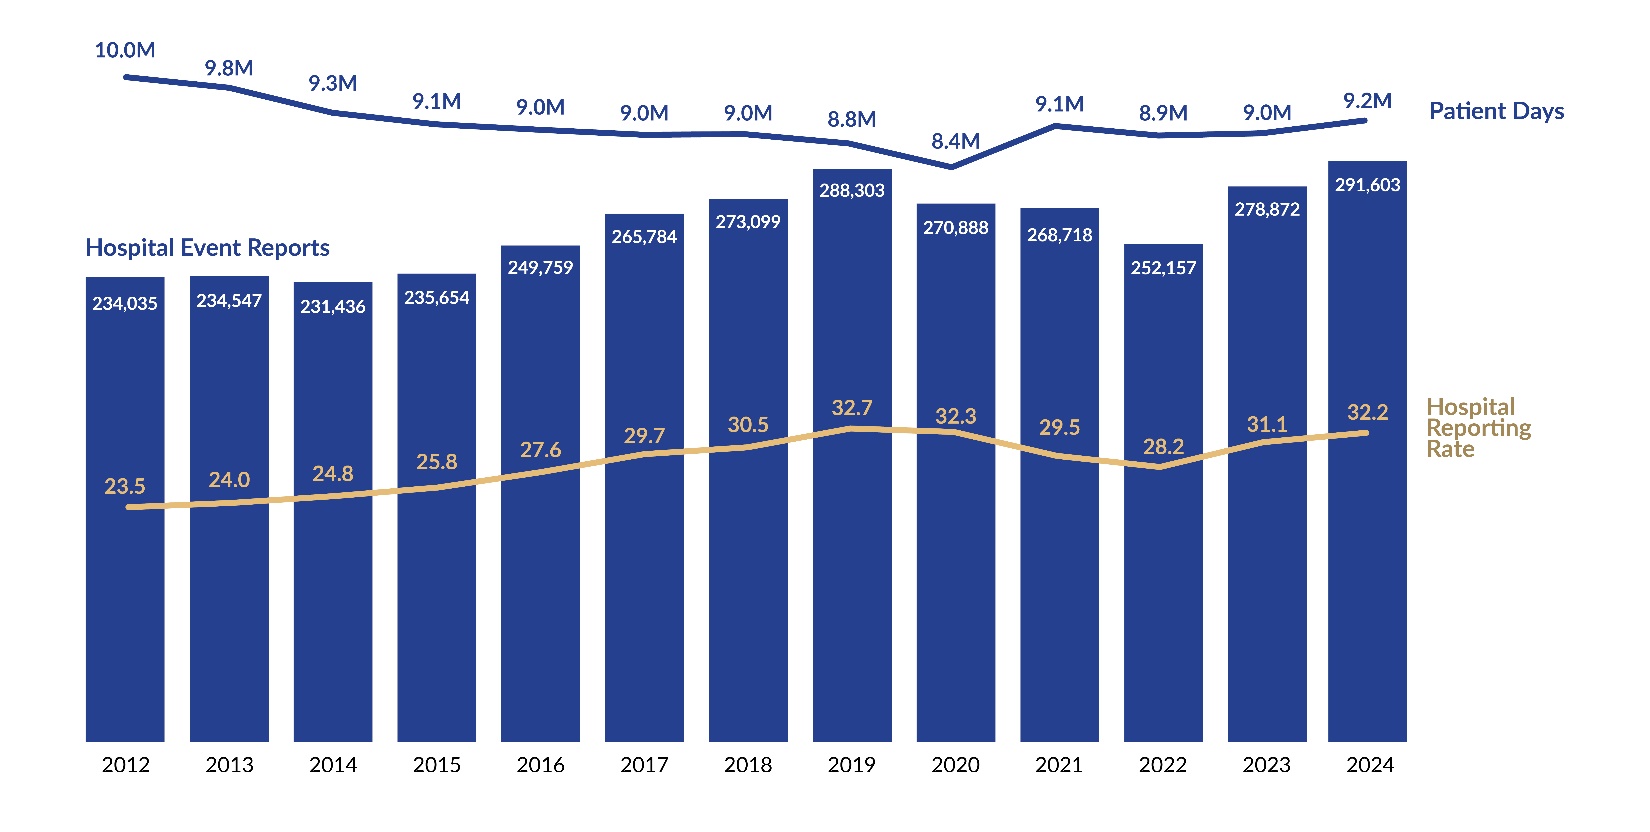
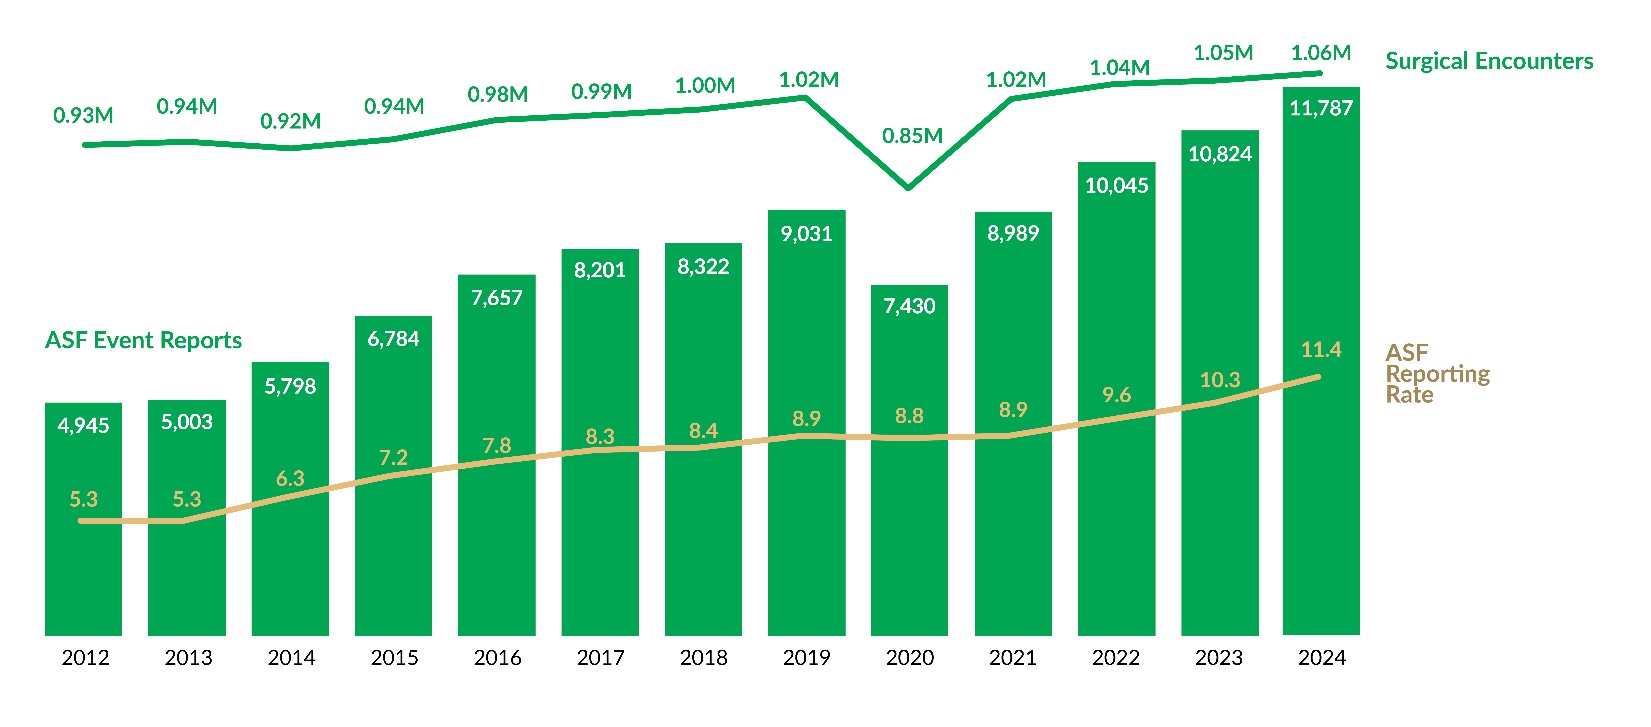
Unlike raw report counts, reporting rates provide a standardized measure for comparison over time. As shown in Figure 3, the preliminary hospital reporting rate for Q1 to Q2 of 2024 is 32.2 reports per 1,000 patient days, 1.1 points higher than the full-year 2023 rate. Similarly, Figure 4 shows that the preliminary ASF reporting rate for 2024 is 11.4 reports per 1,000 surgical encounters, also reflecting a 1.1-point increase from 2023 and continuing the steady upward increase in ASF reporting.


Event Types
Each PA-PSRS report includes an event type and subtype(s) that are assigned by the reporting facility. The reporting taxonomy for incidents and serious events provides for 10 main event types, with 228 possible combinations of event type and subtype.
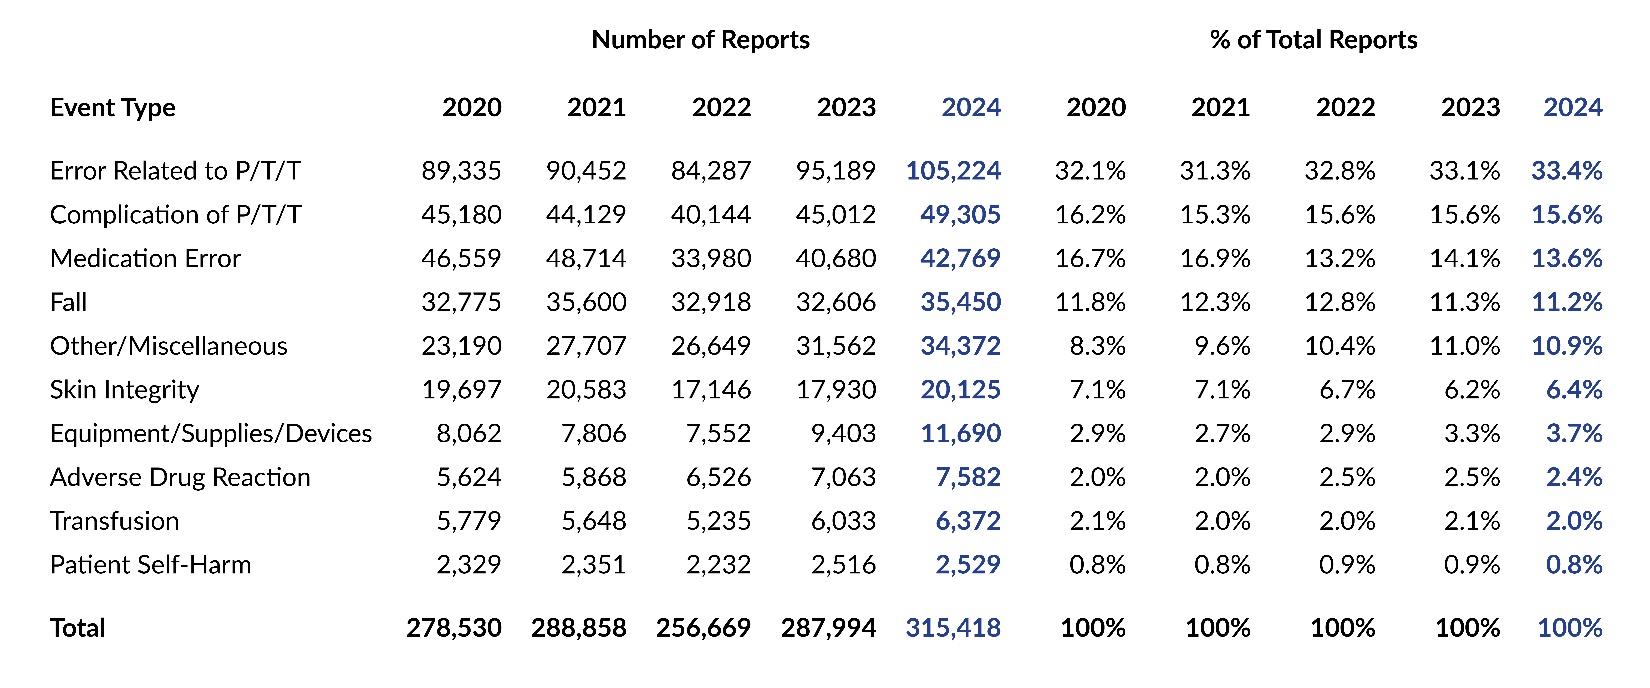
Table 4 shows the number and percentage of all reports submitted for each main event type from 2020 to 2024. Over the past five years, the most frequently reported event type has been Error Related to Procedure/Treatment/Test (P/T/T), with 105,224 reports submitted in 2024, accounting for 33.4% of all reports. From a distribution perspective, the proportion of Equipment/Supplies/Devices reports grew more than any other event type in 2024, rising 0.4 percentage points from 3.3% in 2023 to 3.7% in 2024. Medication Error reports showed the largest decline, dropping from 14.1% in 2023 to 13.6% in 2024, a decrease of 0.5 percentage points.

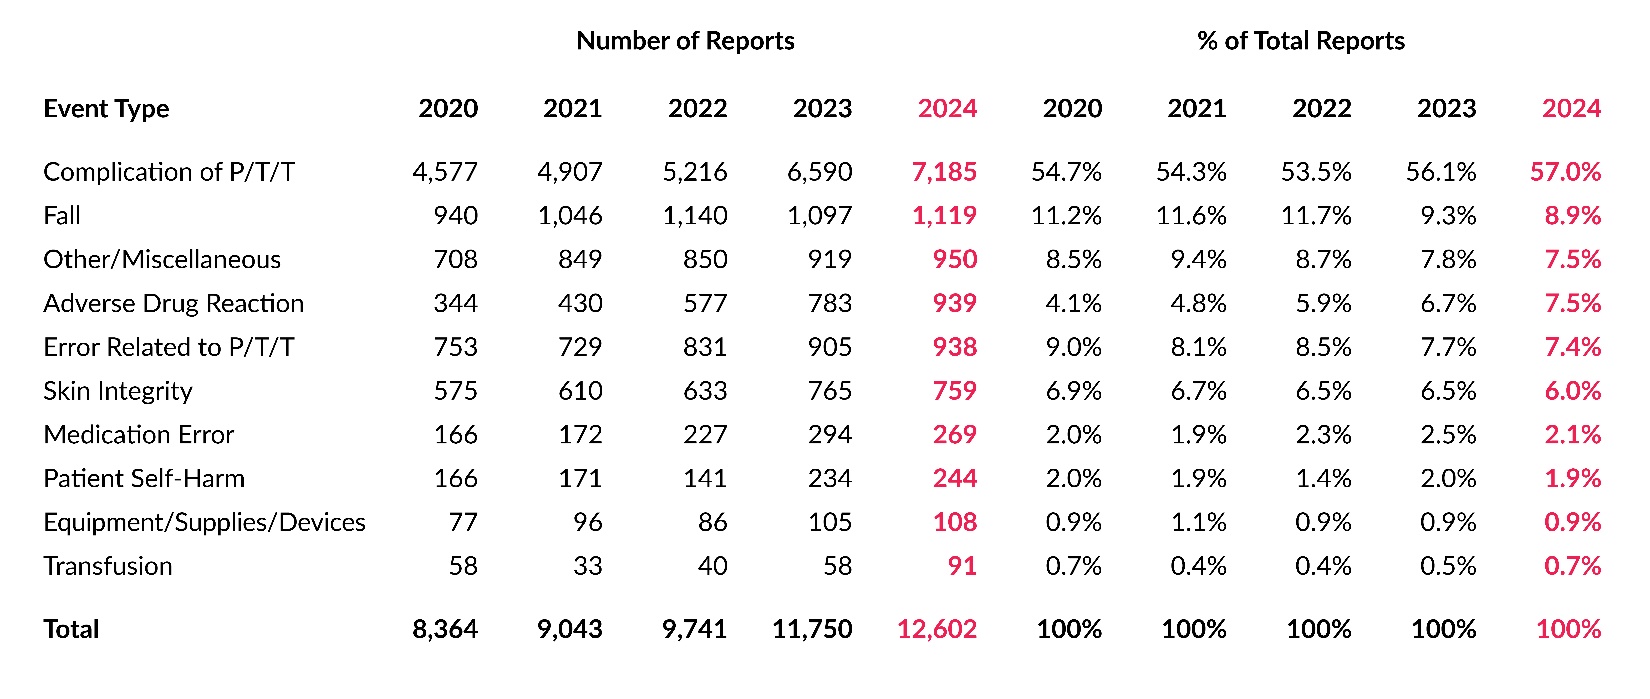
Table 5 shows the number and percentage of serious event reports submitted for each main event type from 2020 to 2024. Over the past five years, Complication of P/T/T has been the most frequently reported serious event type, and in 2024 it showed the largest increase in reports, with 595 more submissions than the previous year. From a distribution standpoint, the largest increase was also seen for Complication of P/T/T for the second consecutive year, rising by 0.9 percentage points from 56.1% in 2023 to 57.0% in 2024. Skin Integrity reports showed the largest decline, decreasing by 0.5 percentage points in 2024. Notably, reports of serious Adverse Drug Reactions (ADRs) have shown a steady increase both in absolute numbers and as a proportion of serious event reports over the past five years. Further analysis reveals this trend is primarily driven by a small number of facilities that have individually demonstrated significant upward reporting patterns during this period. In fact, just two facilities account for 89.1% of the increase observed between 2023 and 2024.

Event Subtypes
Each of the 10 main event types is further classified into subtypes, with each type having between six and 13 subtypes. Table 6 provides a detailed breakdown of all reports and serious event reports, along with their percentage distributions, based on the first level of subtypes for each main event type.
The event subtype with the largest increase in number of reports submitted from 2023 to 2024 was Other/Miscellaneous–Other (specify). Additionally, three subtypes under the Error Related to P/T/T event type saw increases of more than 2,000 reports in 2024: Radiology/imaging test problem, Other (specify), and Surgery/invasive procedure problem. The subtypes with the largest increase in serious event reports from 2023 to 2024 were under the Complication of P/T/T event type: Complication following surgery or invasive procedure, which increased by 111 serious event reports, followed by Catheter or tube problem, which increased by 90 serious event reports.

Event Type and Harm Score
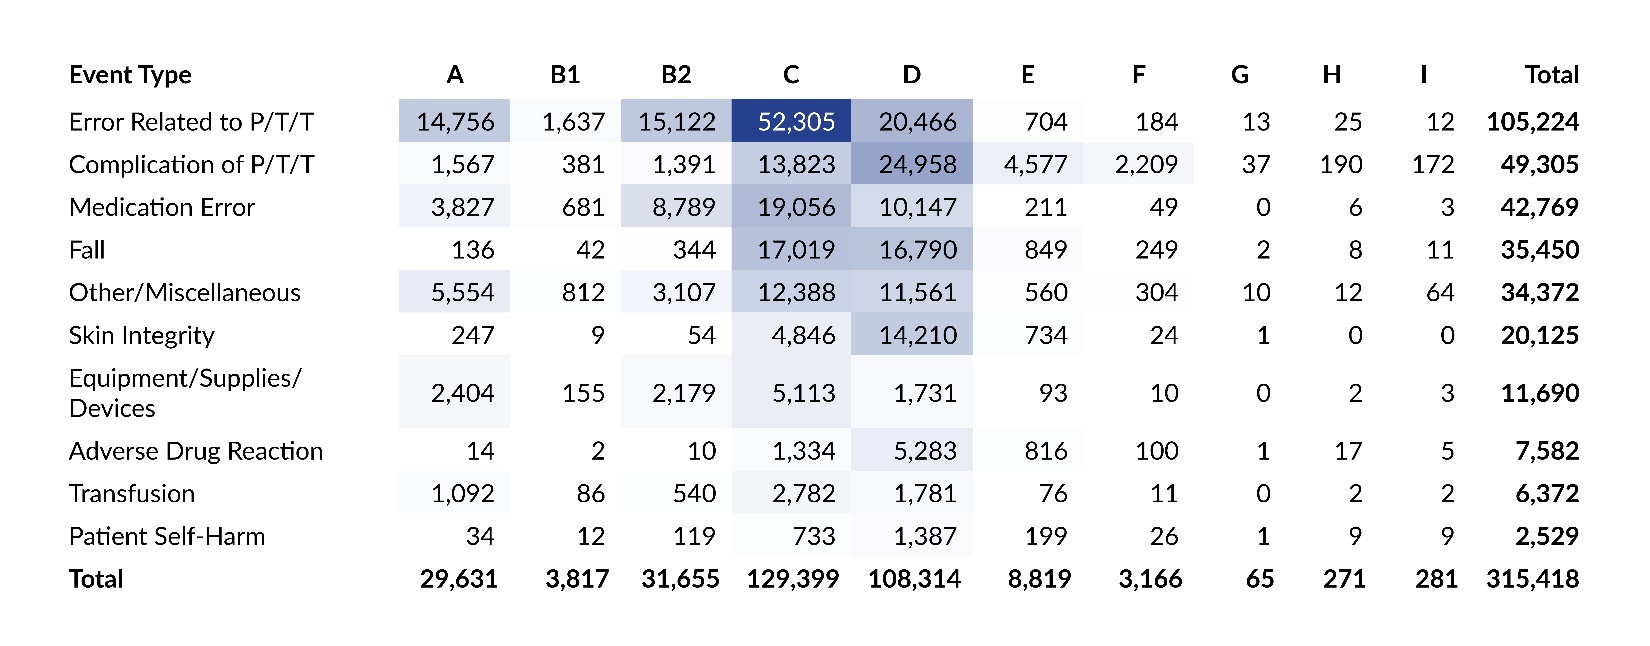
Table 7 presents a cross tabulation of submitted reports by harm score for each of the 10 main event types. The colored cells highlight the most common intersections of event type and harm score in 2024, with darker shades indicating higher concentrations of reports. The intersection of Error Related to P/T/T and harm score C was the most common in 2024, with 52,305 reports and representing 16.6% of all reports. The second most common intersection was Complication of P/T/T and harm score D, with 24,958 reports, representing 7.9% of all reports.

Care Area and Harm Score
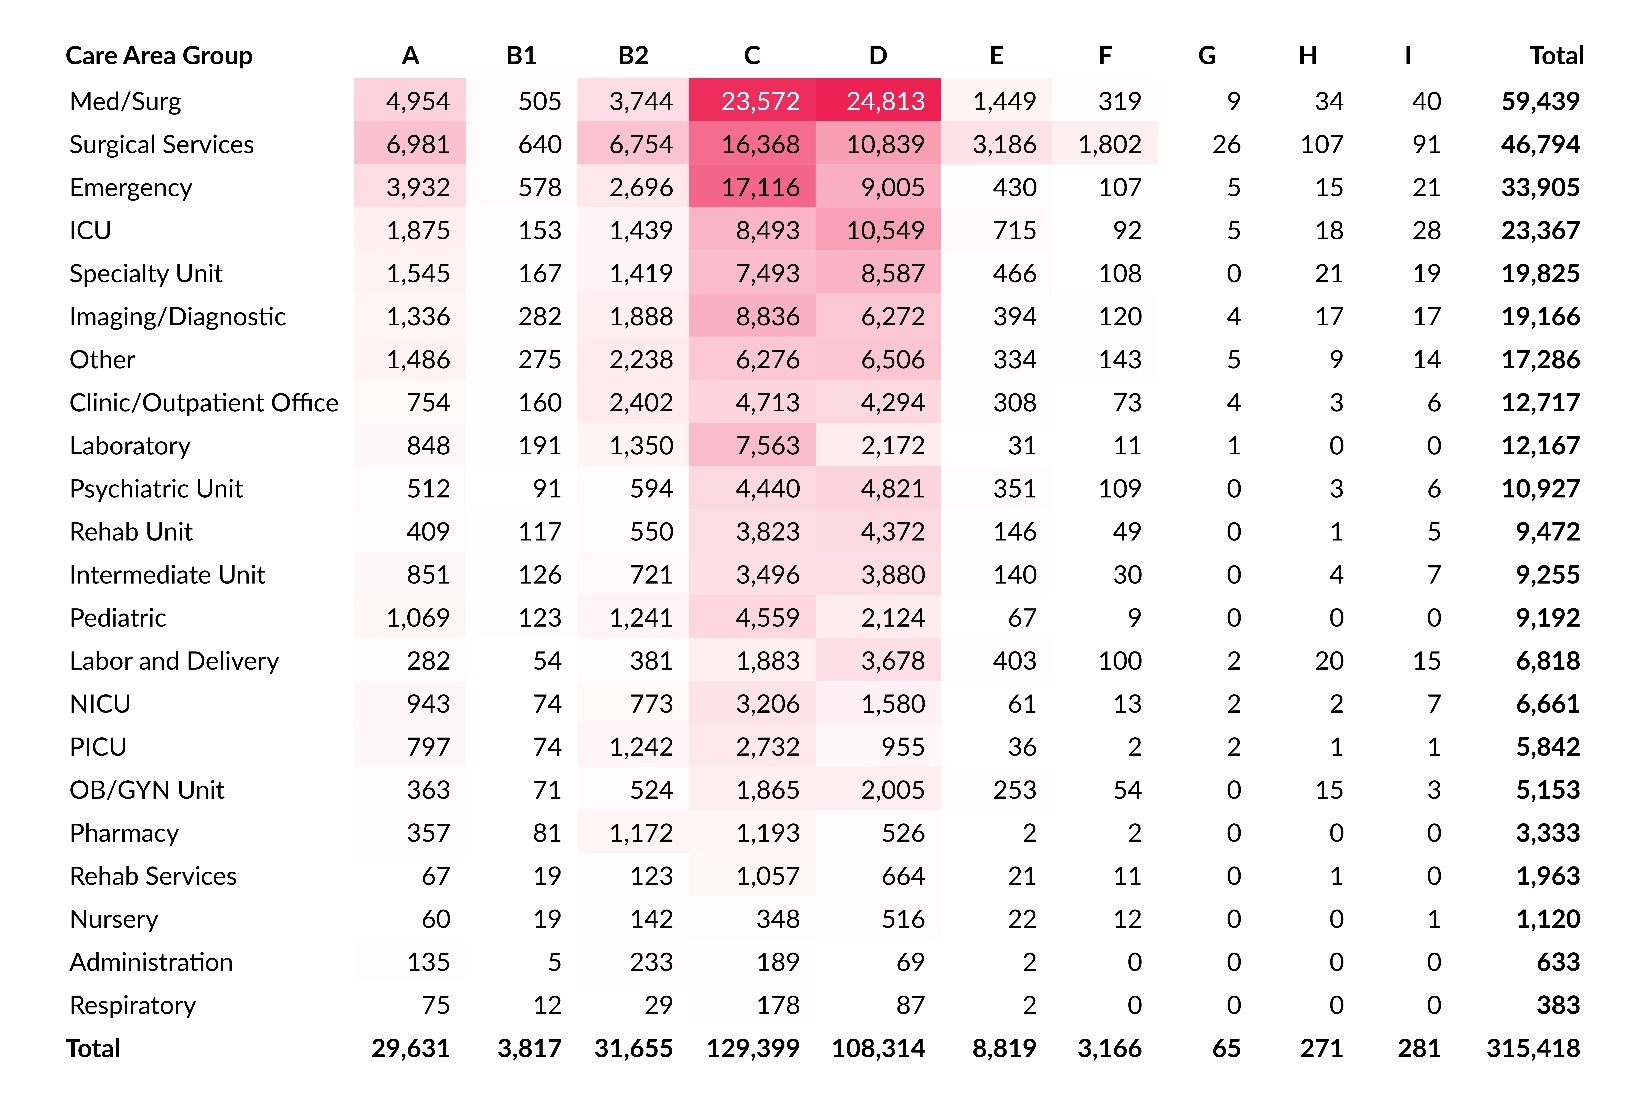
Within PA-PSRS, facilities have 168 options to specify the care area where an event occurred. These care areas are then grouped into 23 broader care area group categories. Table 8 shows a cross tabulation of care area group with harm score. This reflects the same two areas of highest concentration that were seen in the data from 2023, in the cross sections of the Med/Surg care area group and harm scores C and D.

Care Area and Event Type
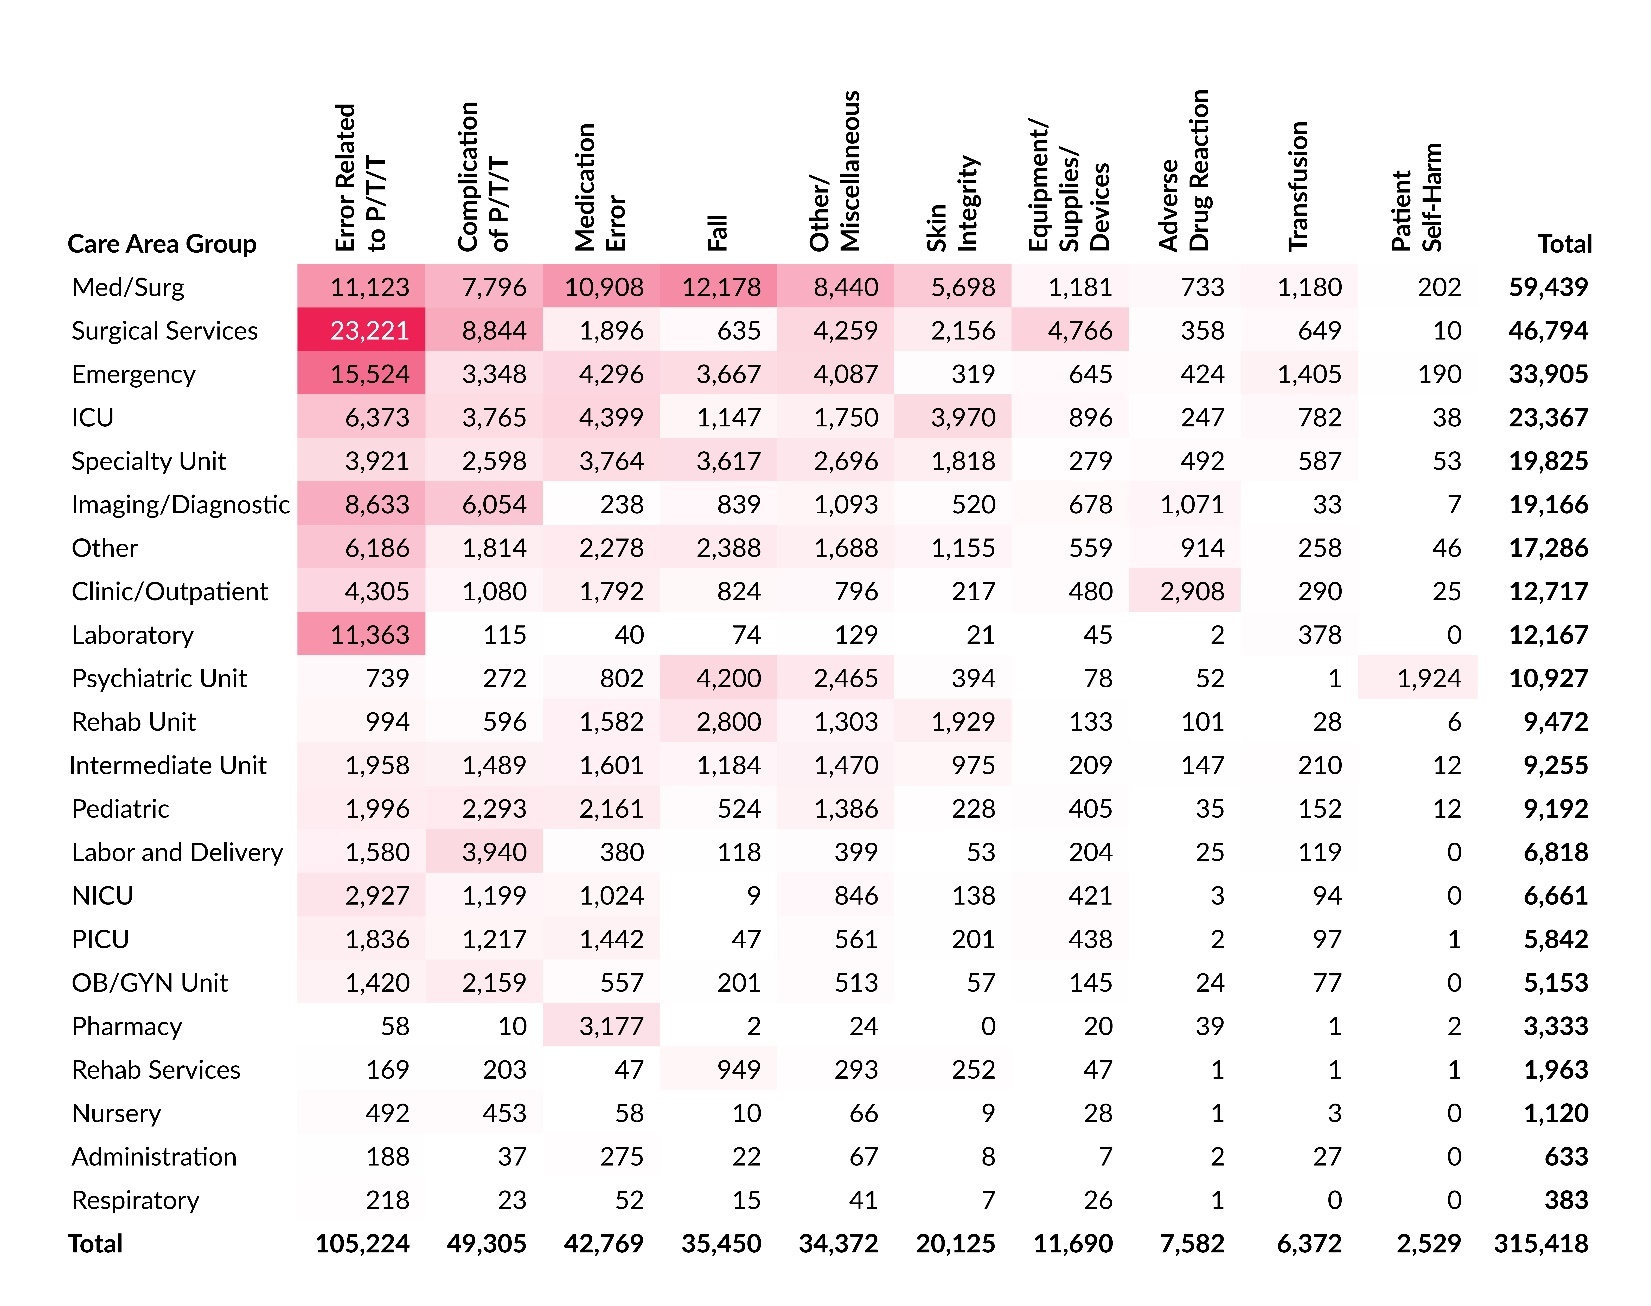
Table 9 shows a cross tabulation of care area group and event type. The three highest concentrations of reports are at the intersections of care area groups Surgical Services and Emergency with Error Related to P/T/T and of Med/Surg with Fall.

Nonhospital Facilities
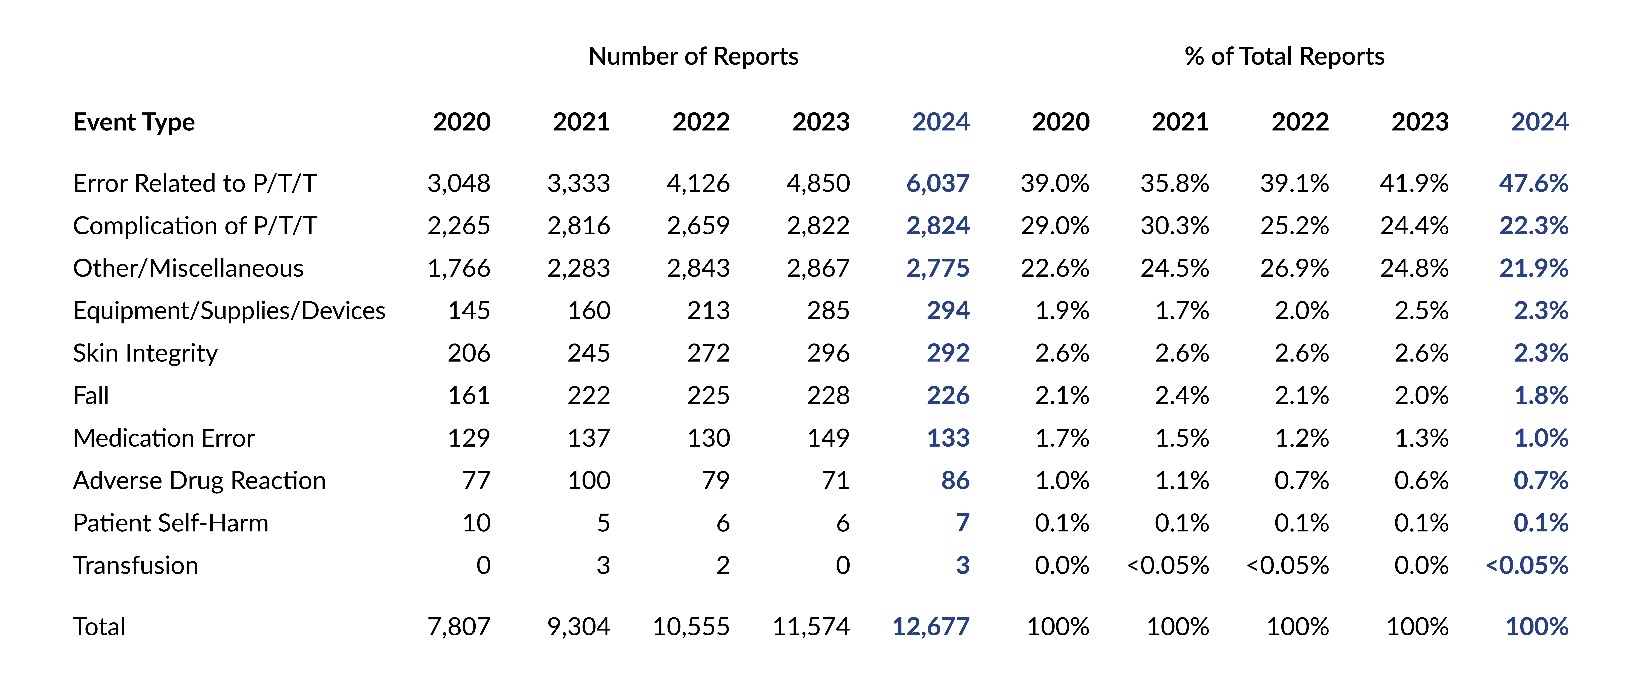
Since the data primarily reflects reports from hospitals, it is important to separately analyze data from nonhospital facilities—mainly ASFs, along with BRCs and ABFs—to identify patient safety issues specific to those settings. Table 10 presents the distribution of reports submitted by these facilities across the 10 main event types from 2020 to 2024. Compared to all facilities combined (Table 4), reports from nonhospital facilities show a distinct distribution. While Error Related to P/T/T remains the most common event type overall, it accounts for a larger share of reports from nonhospital facilities (47.6%) than from all facilities combined (33.4%). Reports of this event type from nonhospital facilities have increased annually, with a notable rise of 1,187 reports (24.5%) between 2023 and 2024. Further analysis indicates that this increase is primarily driven by reports of procedures that were canceled or not performed, with four facilities accounting for more than one-third of the increase.

Table 11 displays the distribution of serious event reports reported by nonhospital facilities from 2020 to 2024. These reports also show a different distribution compared to all facilities (Table 5). While Complication of P/T/T remains the most common serious event type overall, it represents a larger proportion of serious event reports from nonhospital facilities (71.4%) compared to all facilities combined (57.0%).

Discussion
The number of reports submitted to PA-PSRS has varied over the past five years. In 2024, 315,418 reports were received, marking the first time more than 300,000 reports were submitted in a single calendar year. Reporting rates, which allow for normalized comparisons over time, show that the hospital reporting rate has increased for the second consecutive year, while the ASF rate has risen for the fourth. While our analysis identified increases related to several specific variables in 2024, further examination showed these were largely influenced by shifts in a limited number of facilities.
Conclusion
In 2024, the total number of reports, serious event reports, and high harm event reports increased, as did the preliminary reporting rates for hospitals and ASFs. The Patient Safety Authority will continue working with Pennsylvania healthcare facilities to enhance reporting quality and promote patient safety.
Note
This analysis was exempted from review by the Advarra Institutional Review Board.
Data used in this study cannot be made public due to their confidential nature, as outlined in the Medical Care Availability and Reduction of Error (MCARE) Act (Pennsylvania Act 13 of 2002).
Disclosure
The authors declare that they have no relevant or material financial interests.
About the Authors
Shawn Kepner (shawkepner@pa.gov) is a data scientist at the Patient Safety Authority.
Rebecca Jones is director of Data Science & Research at the Patient Safety Authority.
PA-PSRS is a secure, web-based system through which Pennsylvania hospitals, ambulatory surgical facilities, abortion facilities, and birthing centers submit reports of patient safety–related incidents and serious events in accordance with mandatory reporting laws outlined in the Medical Care Availability and Reduction of Error (MCARE) Act (Act 13 of 2002).1 All reports submitted through PA-PSRS are confidential and no information about individual facilities or providers is made public.
The Pennsylvania Health Care Cost Containment Council (PHC4) is an independent state agency responsible for addressing the problem of escalating health costs, ensuring the quality of healthcare, and increasing access to healthcare for all citizens regardless of ability to pay. PHC4 has provided data to this entity in an effort to further PHC4’s mission of educating the public and containing healthcare costs in Pennsylvania. PHC4, its agents, and its staff have made no representation, guarantee, or warranty, express or implied, that the data—financial-, patient-, payor-, and physician-specific information—provided to this entity are error-free, or that the use of the data will avoid differences of opinion or interpretation. This analysis was not prepared by PHC4. This analysis was done by the Patient Safety Authority. PHC4, its agents, and its staff bear no responsibility or liability for the results of the analysis, which are solely the opinion of this entity.