


Introduction
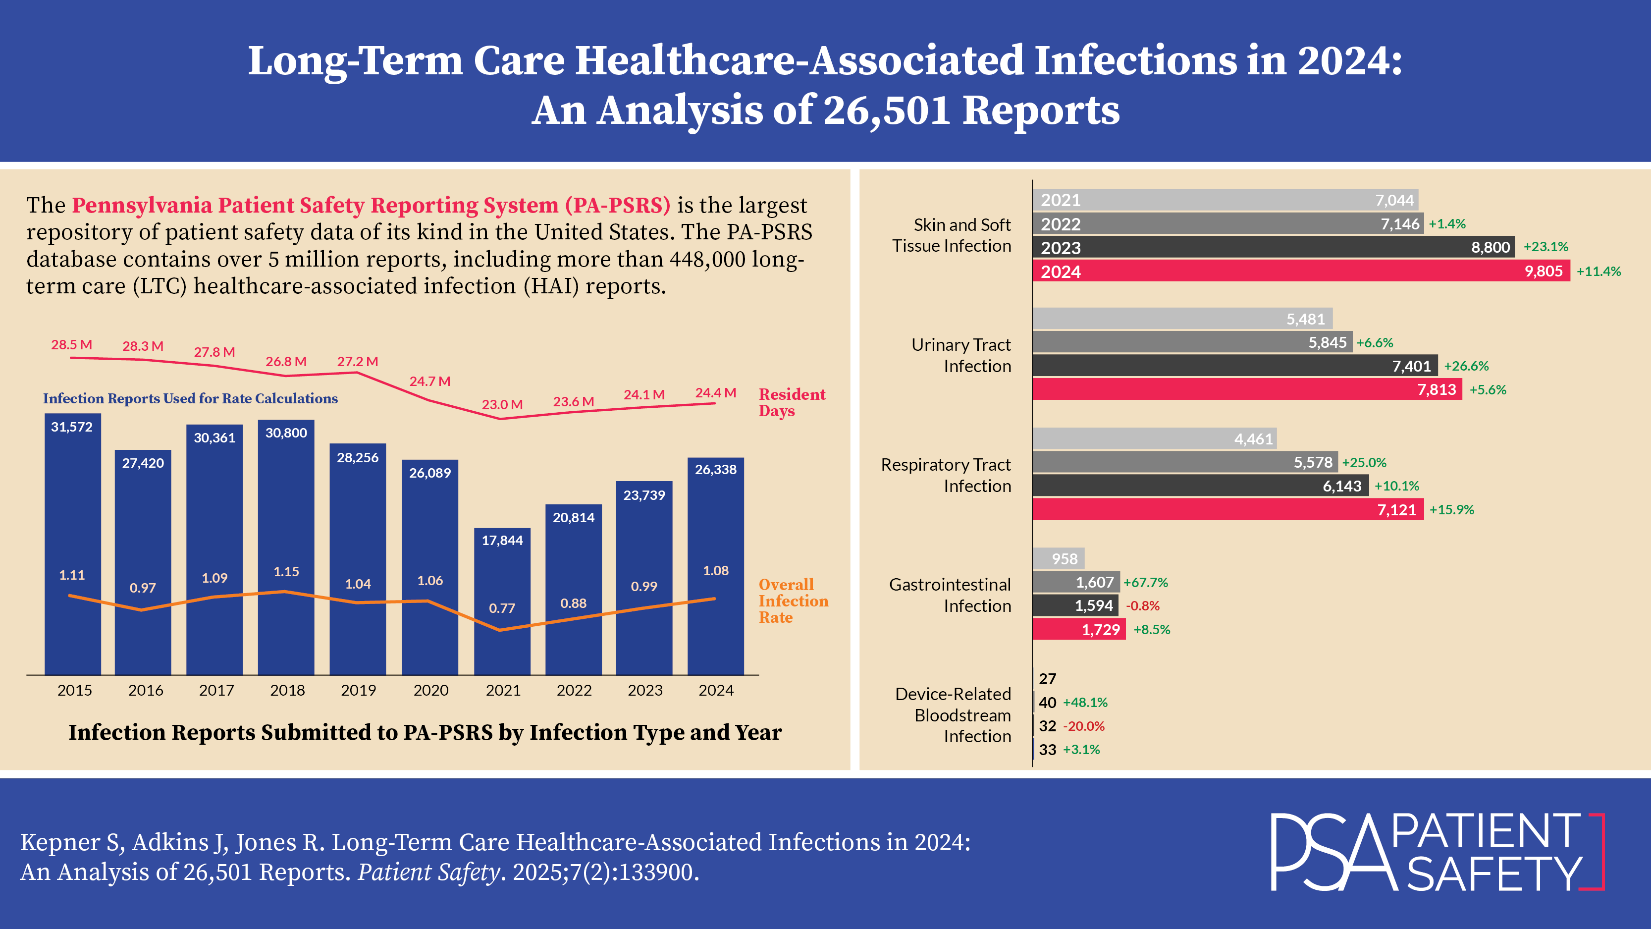
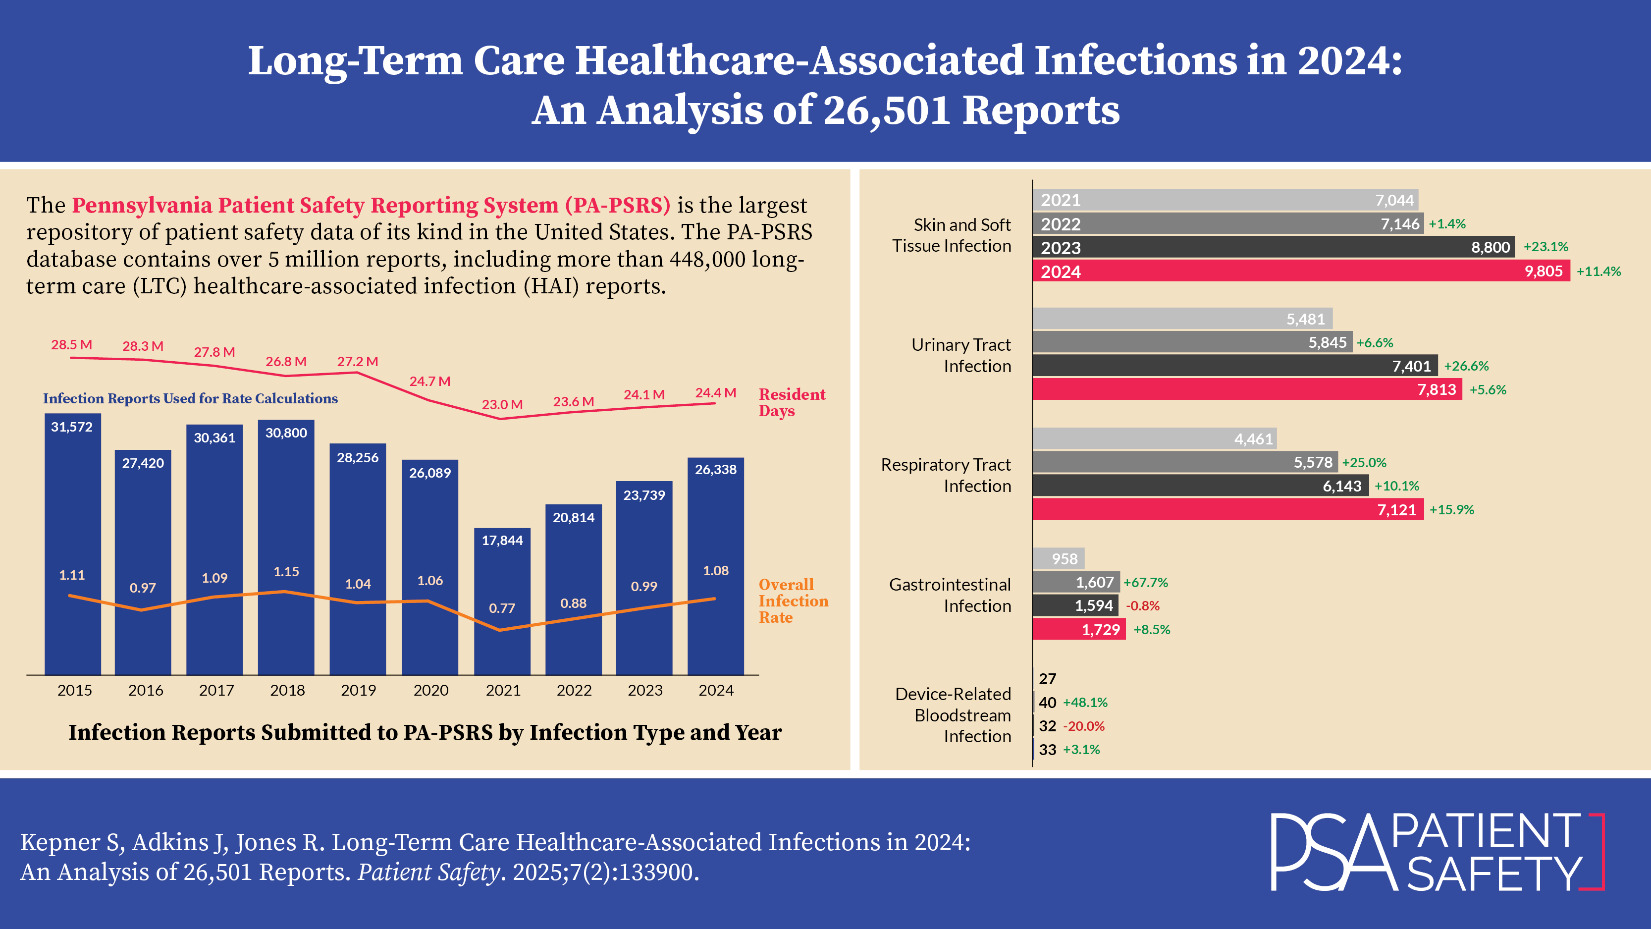
The Pennsylvania Patient Safety Reporting System (PA-PSRS)[1] is the largest repository of patient safety data of its kind in the United States. In addition to over 5 million patient safety event reports from hospitals, ambulatory surgical facilities, abortion facilities, and birthing centers, the PA-PSRS database contains more than 448,000 long-term care (LTC) healthcare-associated infection (HAI) reports submitted since 2009.
Methods
The LTC data from PA-PSRS were extracted on March 1, 2025, to allow extra time for calculating rates based on resident and device utilization days. Report counts for infections are based on the report submission date, while overall infection rates are calculated per 1,000 resident days using the infection confirmation date. Rates for infections associated with urinary catheters and central lines are calculated per 1,000 urinary catheter days or 1,000 central line days, respectively. Reports from LTC facilities and specific care areas were included in rate calculations if resident and device days were entered in PA-PSRS for the corresponding month. Unless otherwise stated, statistical results are presented at a 0.05 significance level.
Results
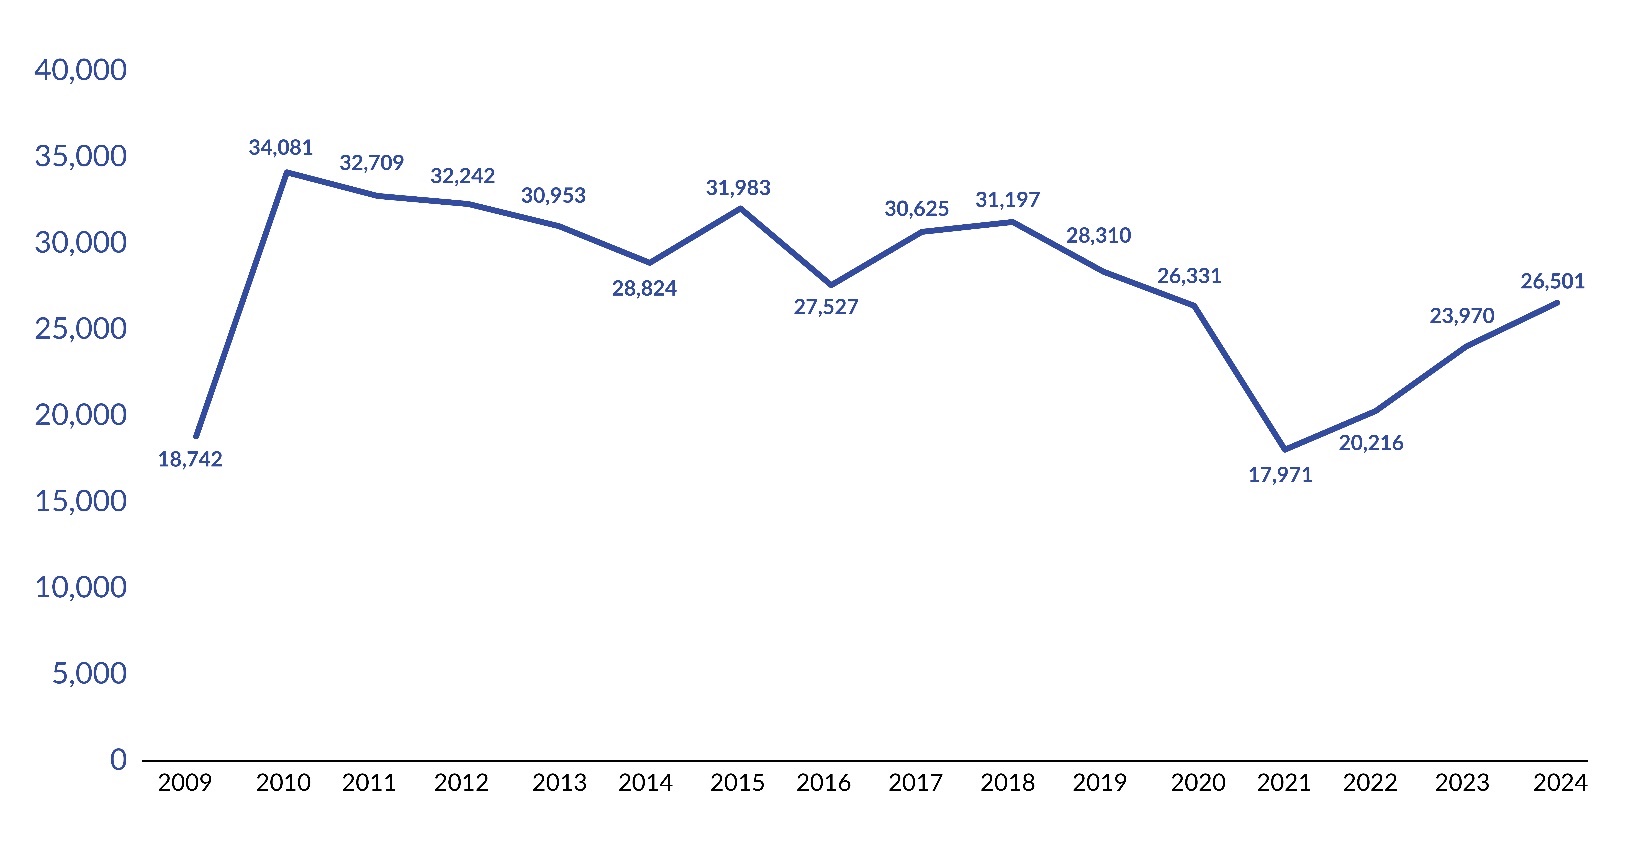
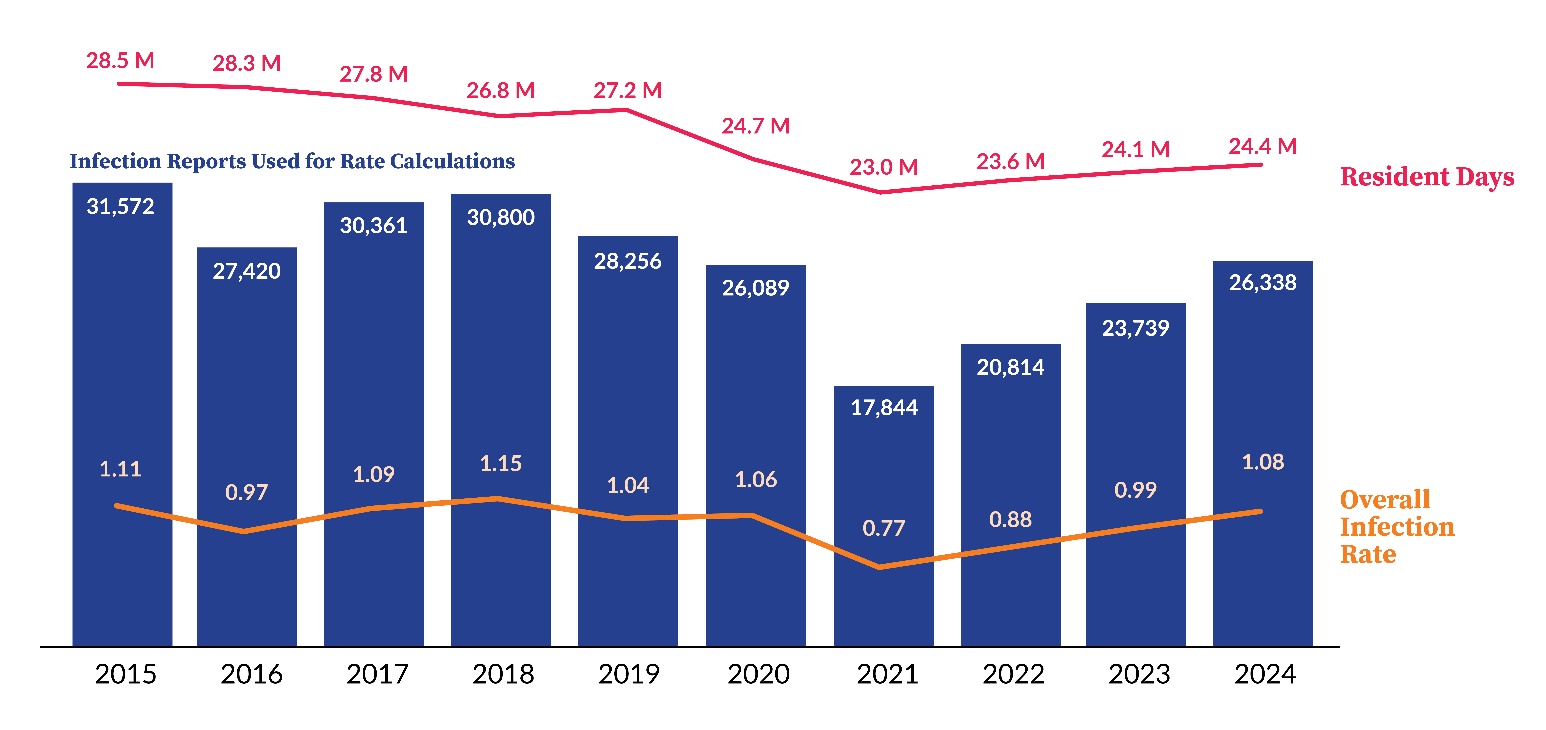
Pennsylvania’s LTC facilities submitted 26,501 infection reports to PA-PSRS in 2024, which is a 10.6% increase over the prior year and the third consecutive annual increase (see Figure 1). As shown in Figure 2, the overall infection rate in 2024 was 1.08 infections per 1,000 resident days, representing a 9.1% increase from 2023. The 2024 rate also established a significant three-year upward trend since the low point of 0.77 in 2021 (R2=0.998, p=0.0011).


Figure 3, which displays infection rates by region, shows that all six regions of the state had an increase in infection rate from 2023 to 2024. The Northeast region had the highest infection rate in 2024, with 1.53 reports per 1,000 resident days, and the Southeast region had the lowest rate, at 0.79. The distribution of LTC infection reports and infection rates by region are shown in Table 1.


LTC Healthcare-Associated Infections
LTC facility reports submitted to PA-PSRS are classified into five main infection types (see Figure 4). For the last four years, skin and soft tissue infections (SSTIs) were the most frequently reported, followed by urinary tract infections (UTIs) and respiratory tract infections (RTIs). These three infection types have increased each year since 2021. The largest annual percentage increase in 2024 occurred with the respiratory tract infection type.

LTC Healthcare-Associated Infection Subtypes
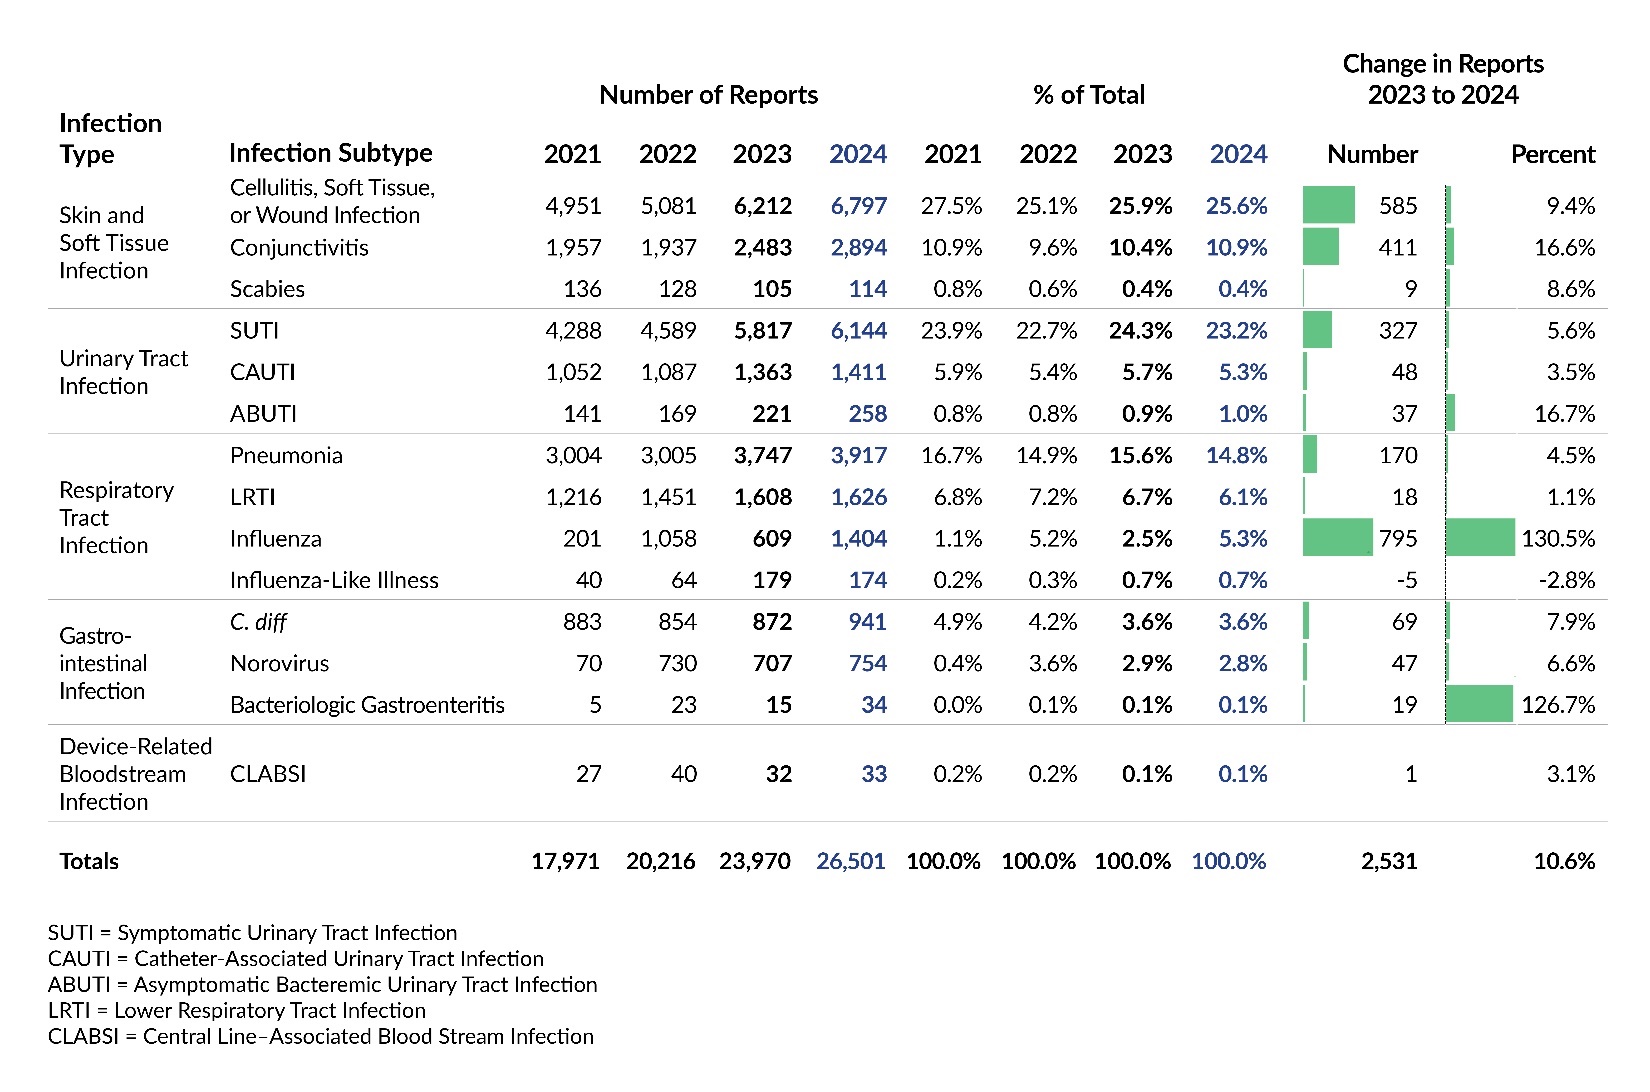
Table 2 shows the number of reports submitted for all infection subtypes for the past four years. In 2024, the most frequently reported subtype was cellulitis, soft tissue, or wound infection, followed by symptomatic urinary tract infection (SUTI) and pneumonia. This ranking has remained consistent for the past three years. Among the 14 infection subtypes, 13 had an increase in the number of reports submitted in 2024 compared to 2023. Influenza showed the largest increase, with 795 more reports (+130.5%). The only subtype that declined was influenza-like illness, but the decrease was minimal, with just five fewer reports.

Care Area
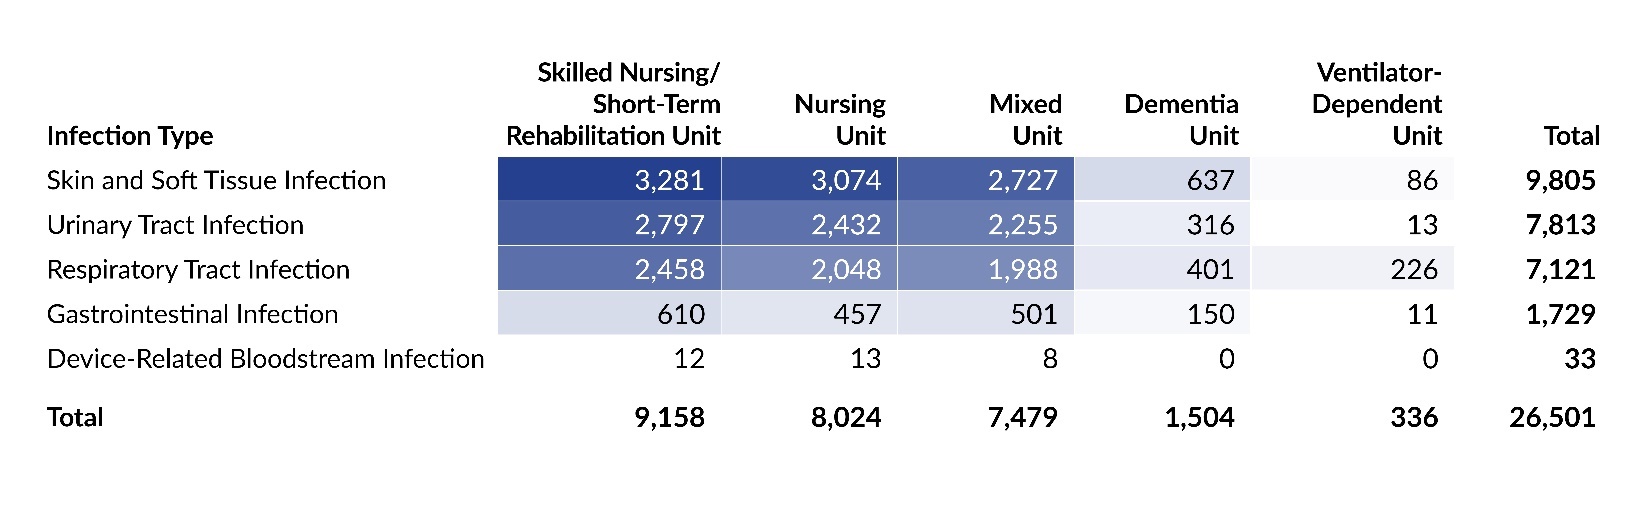
Table 3 shows the distribution of reports submitted in 2024 by infection type and care area. Skilled nursing/short-term rehabilitation units accounted for the largest proportion of infections (34.6%; 9,158 of 26,501). SSTIs were the most commonly reported infection type across all care areas, except in ventilator-dependent units, where RTIs were the most frequent. Table 4 shows the distribution of infection reports submitted in 2024 by infection subtype and care area. The largest concentration of reports was seen with cellulitis, soft tissue, or wound infection in skilled nursing/short-term rehabilitation units.


LTC Healthcare-Associated Infection Rates
Figure 5 shows rates per 1,000 resident days for the five main infection types for 2021 through 2024. In 2024, the overall infection rate increased due to rising rates across all infection types, except for device-related bloodstream infections.

Figure 6 and Table 5 display rates for each infection subtype for 2021 through 2024. The influenza infection subtype saw the largest increase from 2023 to 2024 in both number and percentage, rising from 0.023 to 0.056 reports per 1,000 resident days, representing a 143.5% increase. The only decrease was with CLABSI, for which the rate dropped by 0.015 points or 15.8%.

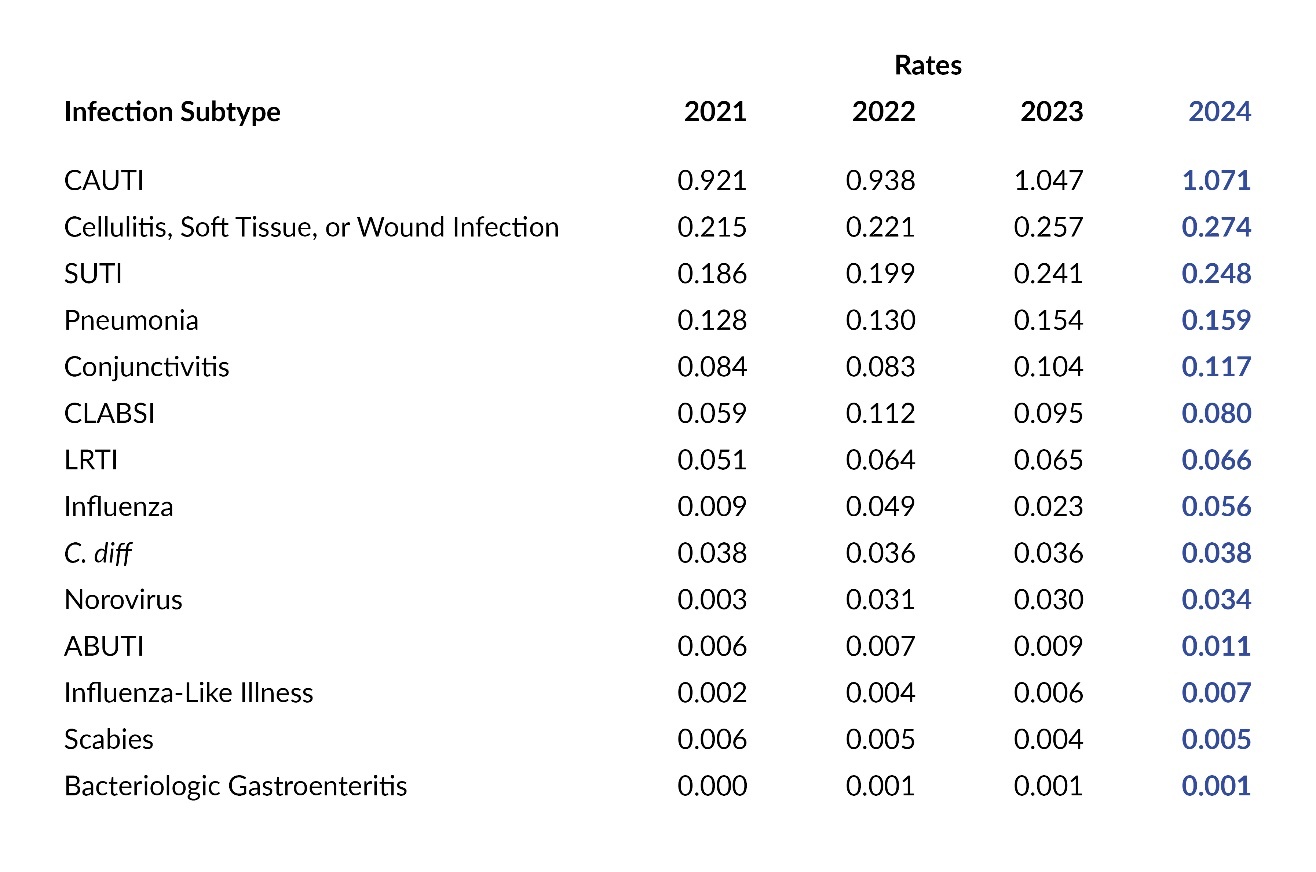
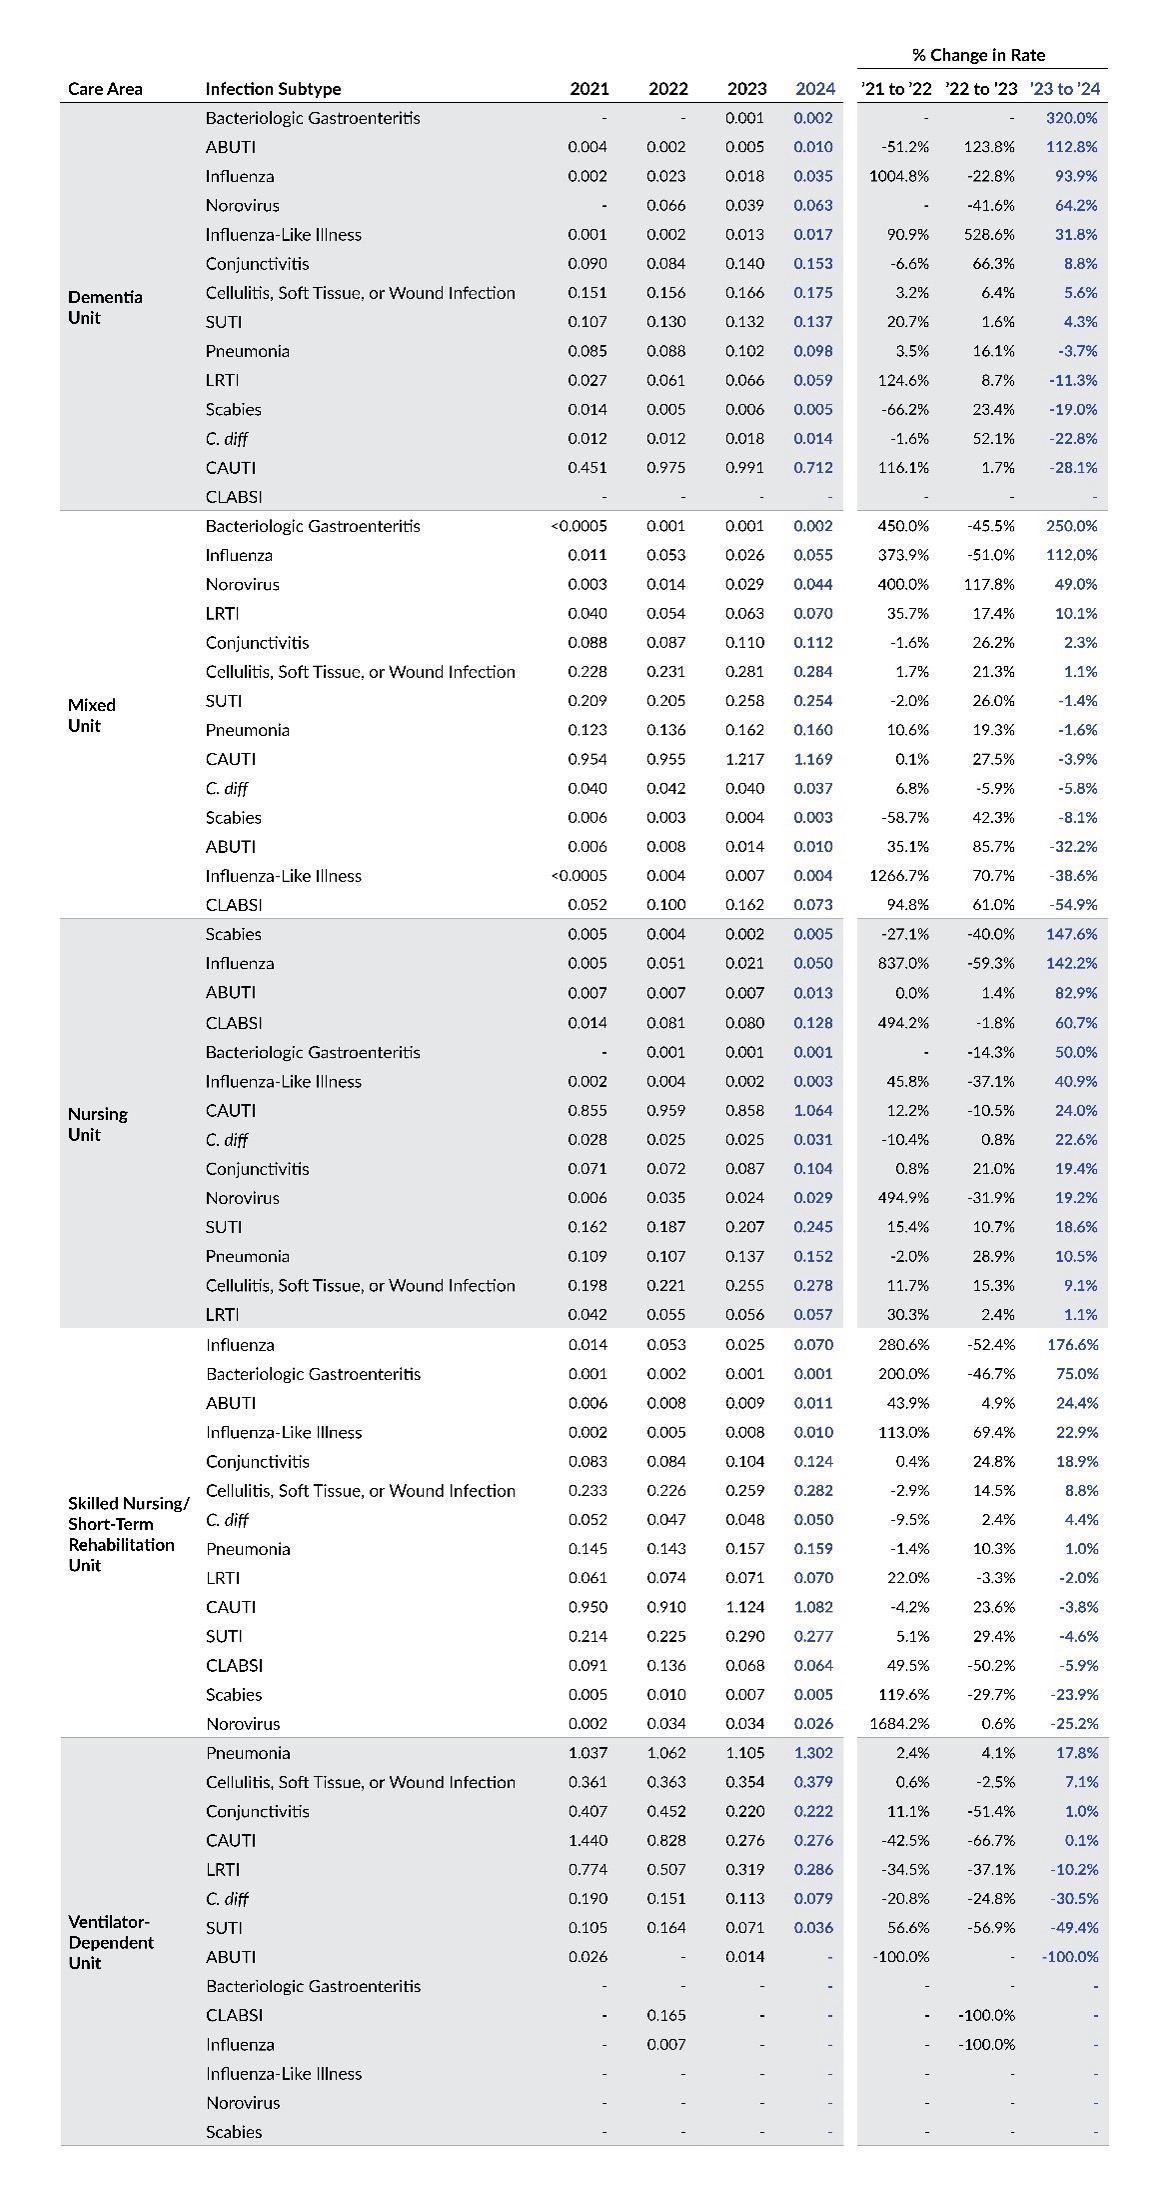
Table 6 displays infection rates by year based on care area and infection subtype. From 2023 to 2024, the largest percentage increases in rates were seen in bacteriologic gastroenteritis within dementia units (+320%) and mixed units (+250%), as well as influenza in skilled nursing/short term rehabilitation units (+176.6%).
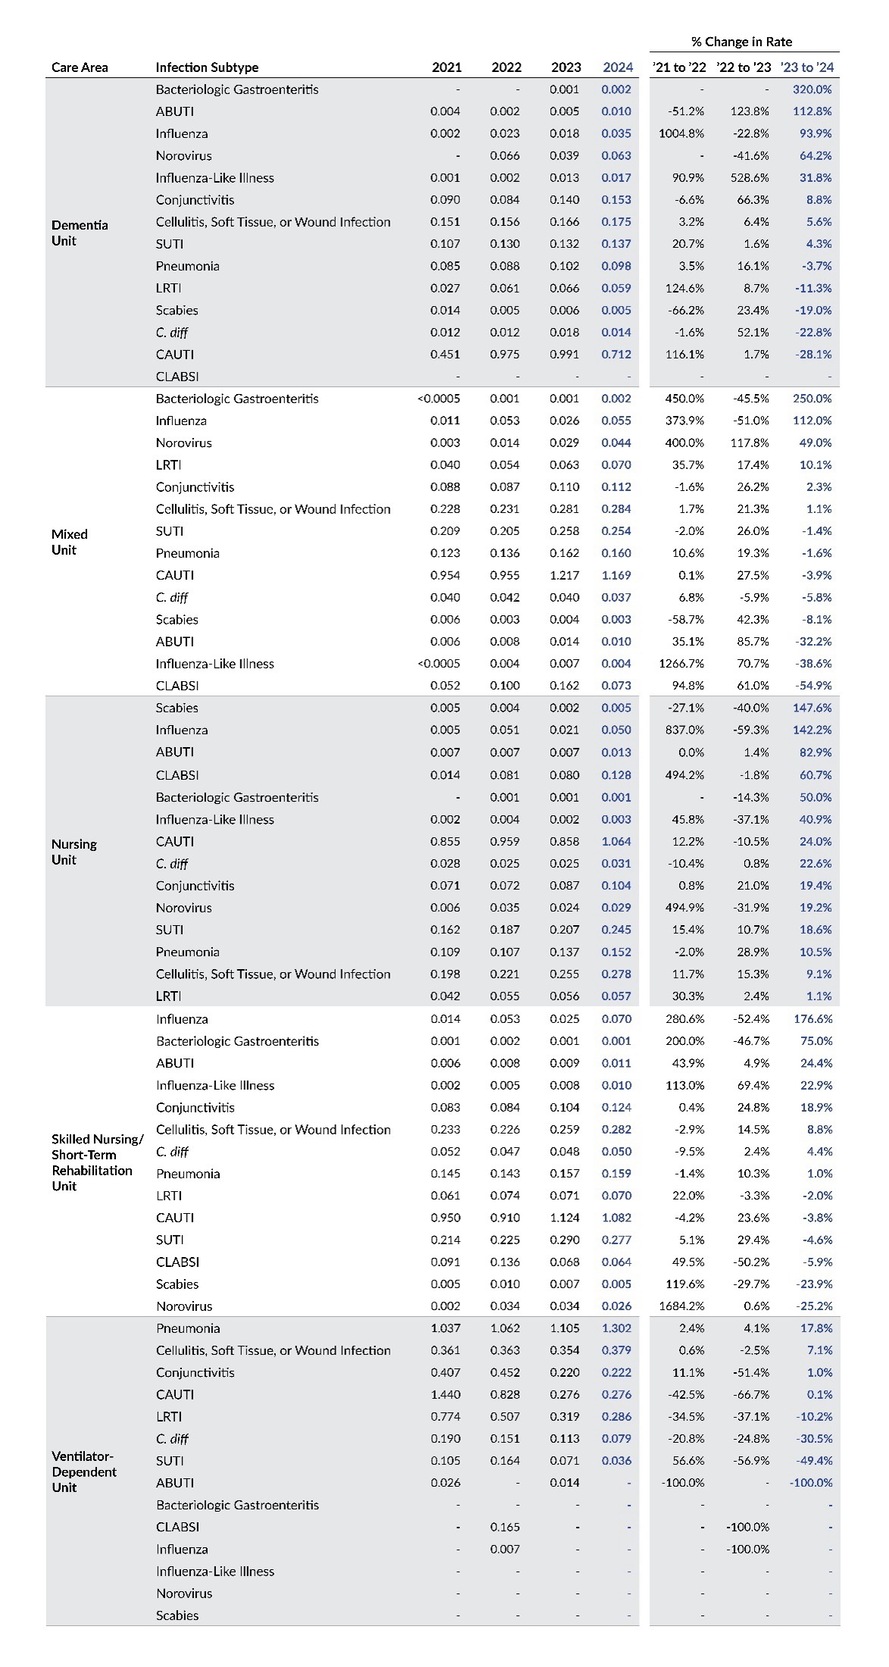
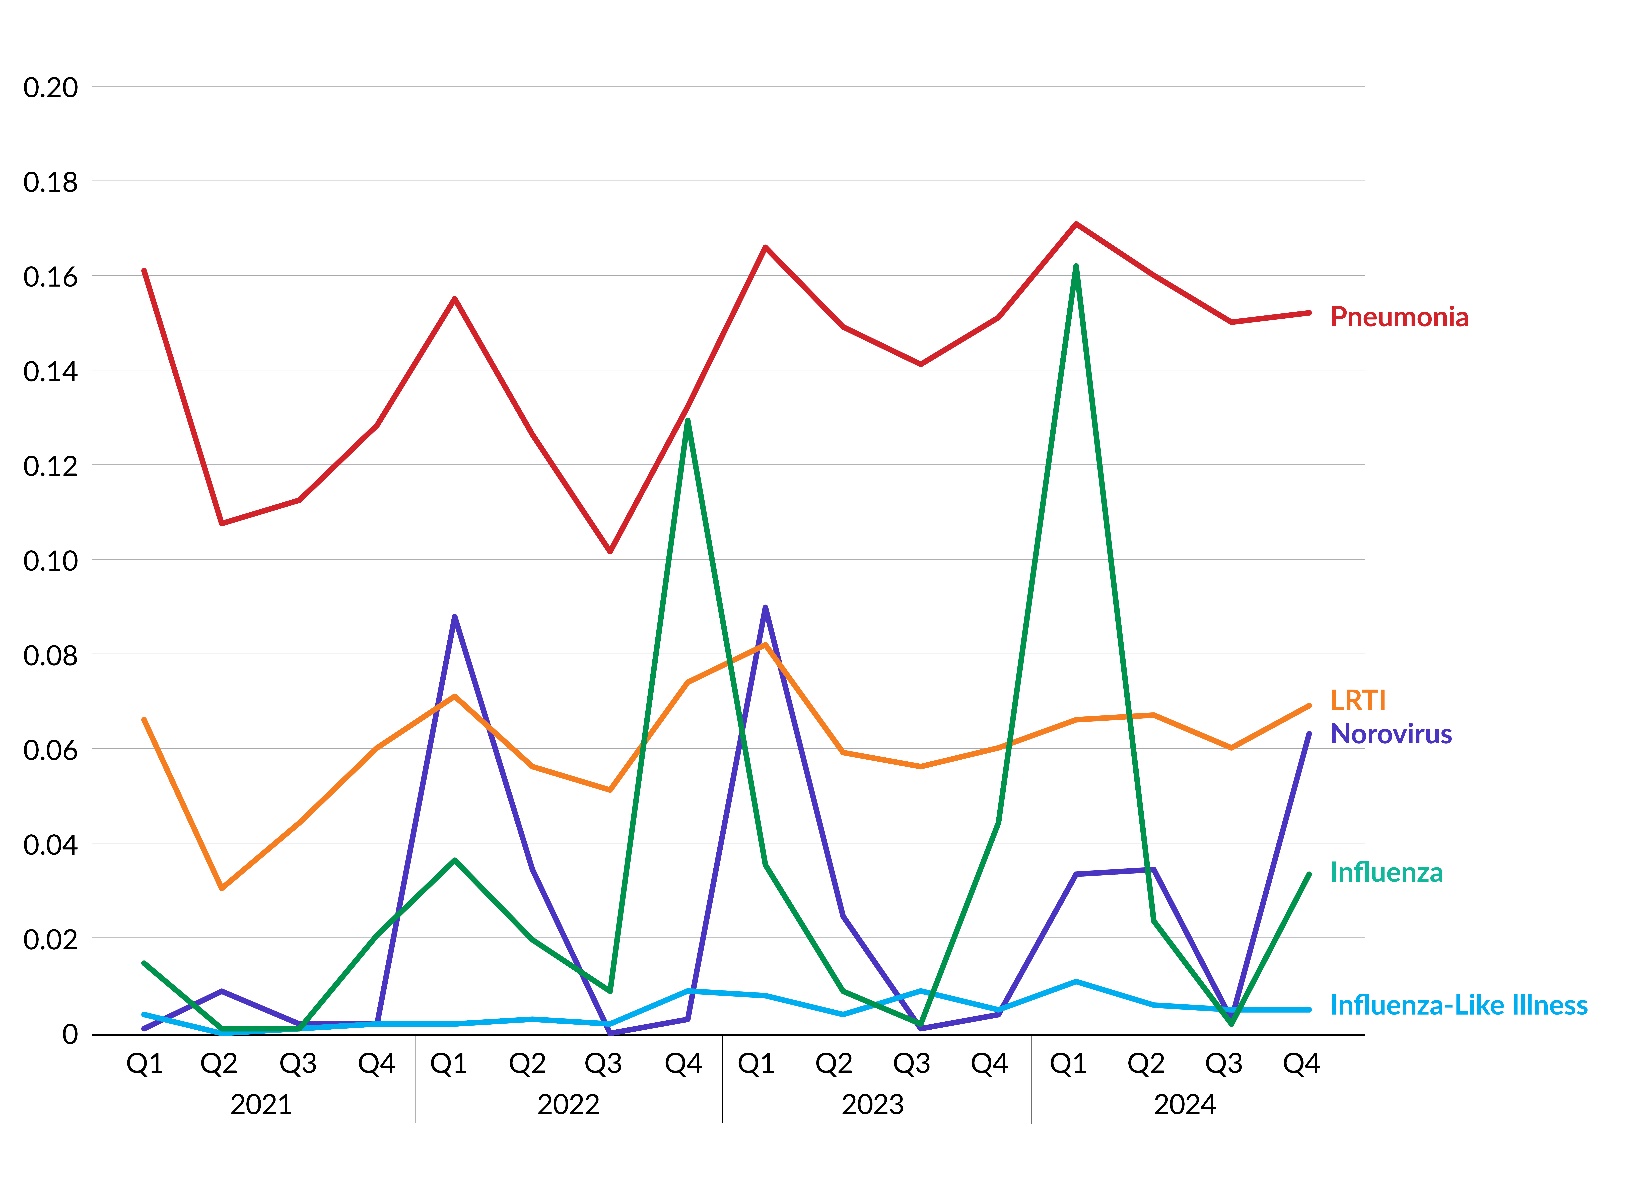
Figure 7 and Table 7 display infection rates for seasonal infection subtypes (i.e., influenza, influenza-like illness, pneumonia, lower respiratory tract infection [LRTI], and norovirus) by quarter from 2021 through 2024. These rates are calculated as the number of infections by quarter per 1,000 resident days. The rates for influenza, influenza-like illness, and pneumonia were highest in Q1 2024, while this quarter showed a lower rate for norovirus compared to Q1 in the prior two years.


Discussion
In 2024, Pennsylvania’s LTC facilities submitted 26,501 infection reports to PA-PSRS and recorded 24.4 million resident days, with an overall infection rate of 1.08 per 1,000 resident days based on eligible reports. This marks a 10.6% increase in total infection reports and a 9.1% rise in the infection rate compared to 2023. The overall infection rate increased due to rising rates across all infection types except for device-related bloodstream infections. Notably, 2024 represents the third consecutive annual increase, with the rate rising from 0.77 in 2021 to 1.08 in 2024.
The continued increase in total number and rate of infections reported to PA-PSRS may be associated with enhanced detection and reporting of infections as a result of the Patient Safety Authority’s (PSA) intensive outreach and educational efforts. To address the frequent turnover of infection preventionists (IPs) in LTC facilities, PSA infection prevention advisors have implemented a comprehensive program providing support, guidance, and education, including new IP orientations, regional educational symposia, newsletters, webinars, and evidence-based tools and resources. PSA has also worked to address potential underreporting by formally notifying LTC facilities in the bottom 10th percentile and those reporting zero infections during the previous year that they may not be meeting reporting requirements as set forth in Act 52. PSA infection prevention advisors have also contacted these facilities to offer support and guidance for performing surveillance and reporting.
Conclusion
In 2024, there was a rise in both the number of infection reports submitted to PA-PSRS and the overall infection rate across Pennsylvania’s LTC facilities. The increase in overall rate in 2024 was driven by increases in the rates of all infection types except for device-related bloodstream infections. This third consecutive annual increase in the number and rate of reported infections may be associated with enhanced surveillance and reporting in LTC facilities stemming from PSA’s intensive outreach and educational efforts.
Note
This analysis was exempted from review by the Advarra Institutional Review Board.
Data used in this study cannot be made public due to their confidential nature, as outlined in the Medical Care Availability and Reduction of Error (MCARE) Act (Pennsylvania Act 52 of 2007).
Disclosure
The authors declare that they have no relevant or material financial interests.
About the Authors
Shawn Kepner (shawkepner@pa.gov) is a data scientist at the Patient Safety Authority.
JoAnn Adkins is a registered nurse and a senior infection preventionist for the Patient Safety Authority.
Rebecca Jones is director of Data Science & Research at the Patient Safety Authority.
PA-PSRS is a secure, web-based system through which Pennsylvania long-term care facilities submit reports of healthcare-associated infections in accordance with mandatory reporting laws outlined in the Medical Care Availability and Reduction of Error (MCARE) Act (Act 52 of 2007).1 All reports submitted through PA-PSRS are confidential and no information about individual facilities or providers is made public.