
Introduction
Radiation therapy (RT) is a cornerstone of cancer treatment1 and has been in clinical use for over a century.2 Studies have estimated that approximately 50% of all cancer patients could benefit from RT as part of their treatment plan,3,4 underscoring its widespread use and critical role in oncology. Despite the therapeutic benefits, RT creates risk of harm, and patient and staff safety remains a significant concern.5–7 Previous publications have estimated between 0.07% and 6% of patients undergoing RT experience a safety event,8–12 with a subset of these resulting in clinically significant harm. Events can include a range of adverse outcomes, such as overdose or underdose of radiation, anatomical sites with unintended exposure (i.e., wrong site or side), delays in treatment, or equipment-related failures—all of which may compromise treatment efficacy, increase toxicity, or lead to long-term morbidity.12–14 As RT techniques become increasingly complex, understanding and mitigating these risks is essential to ensuring safe and effective cancer care.
The purpose of this retrospective-mixed-methods study of Pennsylvania Patient Safety Reporting System (PA-PSRS)[1] event reports was to explore the frequency and nature of the patient safety events directly involving RT. We expand upon prior studies by analyzing the relation among event type, whether it reached the patient, phase of RT when the risk factor originated, and risk factor (i.e., event impetus) across the sample of events. Furthermore, we provide a list of strategies that may mitigate the risk factors identified in this study.
Methods
Data Source and Sample
Data in this study were derived from event reports submitted by licensed healthcare facilities to the PA-PSRS acute care database. Pennsylvania laws mandate reporting of patient safety events ranging from a near miss to those resulting in serious harm. Event reports do not include medical records, but do contain information from structured fields (e.g., event date, patient age, care area) and unstructured fields (e.g., free text), which are used to summarize the conditions and actions related to the event.
Our query of the PA-PSRS database for event reports used both inclusion and exclusion criteria. The inclusion criteria were a two-year period (event occurrence dates: January 1, 2022–December 31, 2023), 10 care area types (Bone Marrow Unit, Imaging – MRI, Imaging – Nuclear Medicine, Medical/Oncology Unit, Medical/Surgical/Oncology Unit, O/P Oncology Clinic, O/P Oncology/Hematology, Pediatrics Oncology Unit, Radiation Oncology, Surgical Oncology Unit), and presence of one or more of 67 keywords related to RT.[2] Event reports were excluded from the query output if they were assigned to the PA-PSRS Event Type Description of “Falls,” “Patient Self-Harm,” or “Transfusion.”
The query produced 671 event reports, which were de-identified and managed by the first author. The first author then reviewed the reports with co-authors for the following inclusion and exclusion criteria:
-
Patient safety events were included if they did or could have led to erroneous RT, either external RT or internal RT. We defined erroneous RT as treatment that deviated from what was intended or appropriate, and had the potential to cause harm. All included events were directly related to the planning for, administration of, and/or monitoring of RT. Only events that led to or would have led to a wrong dose or delay in treatment were included in the study sample.
-
We excluded the following types of event reports from our study that were not directly related to erroneous RT: intravenous infiltration, skin tear, health complication without a description of safety concerns, medication overdose during CT simulation (e.g., propofol), misdiagnoses (e.g., leading to unnecessary treatments), and inefficient processes that had no clear implications for patient safety.
After reviewing the events and applying the inclusion and exclusion criteria, the study sample consisted of 245 event reports.
Design, Analysis, and Variables Coded
We applied a retrospective mixed-methods design with an exploratory sequential approach,20 beginning with qualitative data collection followed by quantification for further analysis. The qualitative data from PA-PSRS event reports were analyzed through directed content analysis,21,22 utilizing a framework method20,23,24 with variable categories informed by existing literature.11,25–29 These variables were quantified by frequency and examined through descriptive analysis. Descriptive analysis is a quantitative approach that aims to explore phenomena, identify patterns, and enhance understanding of their occurrence.30,31 This is often achieved through visual data presentations highlighting various combinations of variables, facilitating triangulation of the findings.
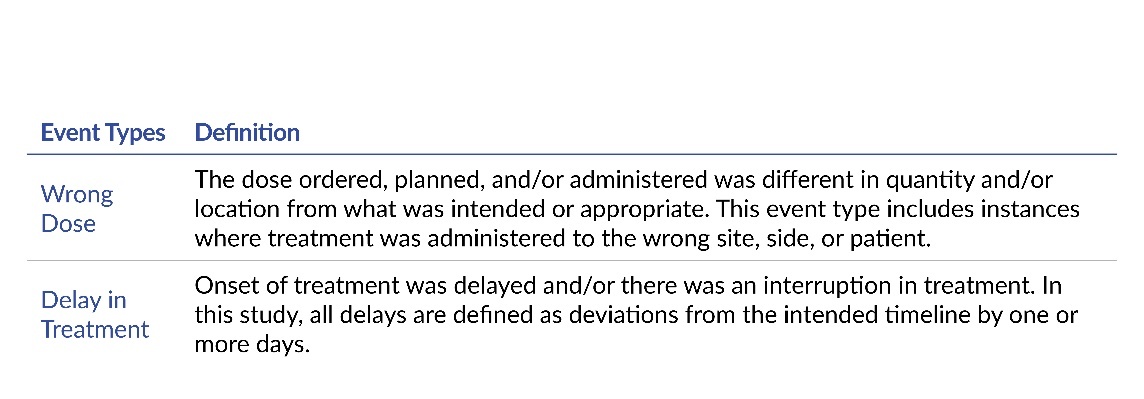
In each of the event reports, the event date, facility size, and patient’s age and gender were obtained from the structured fields. By examining the unstructured fields in each report, the authors coded for one phase of RT, one risk factor (see Table 1 for a list), one event type (see Table 2 for a list) and whether the report described an event that reached the patient (i.e., non–near miss).

The phases11,16,32 of RT correspond with the primary categories of activity performed by the physician, medical physicist, radiation therapist, dosimetrist, and supporting staff. The phase of RT was coded based on when the risk factor originated. The risk factor represents the variable that was the impetus and influenced, or likely influenced, the occurrence of the event type. The event type represents how the patient was or could have been affected. The event was classified as reaching the patient if it affected the patient or interrupted care, as opposed to a near miss that did not reach the patient due to chance or active intervention.
Results
Demographics
Of the 245 event reports that met inclusion criteria, 229 specified the patient’s sex at birth. Among those reports, 58% (132 of 229) involved a female and 42% were male (97 of 229). The patients ranged in age from 2 years to 99 years, with a mean of 65 years and a median of 66 years (25th percentile was 57 years and 75th percentile was 75 years). The 245 event reports were submitted by 40 different acute care hospitals that ranged in size from fewer than 100 beds to more than 300 beds. Across the 40 hospitals, nine hospitals reported eight or more event reports (maximum of 53 event reports from two hospitals, which were also among the largest hospitals in Pennsylvania).
Event Types
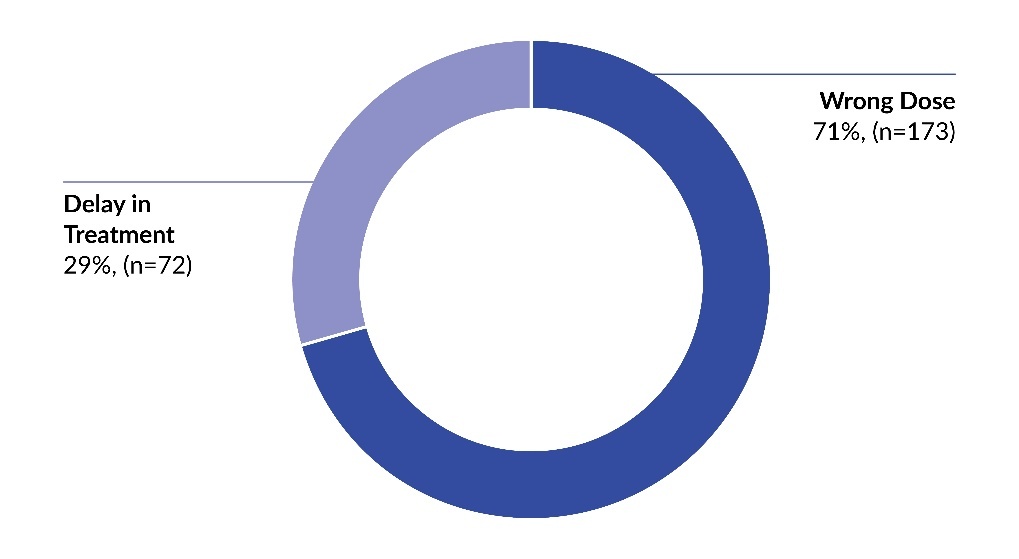
Within the sample of 245 event reports, 71% (173 of 245) described a wrong dose and 29% were a delay in treatment (see Figure 1). Among the wrong dose events, 43% (75 of 173) reached the patient and 57% (98 of 173) did not reach the patient (i.e., near miss). Wrong dose events included instances where treatment was administered to the wrong site, side, or patient. All delay in treatment events reached the patient (100%, 72 of 72).
.jpeg)
Event Types and Phases of Radiation Therapy
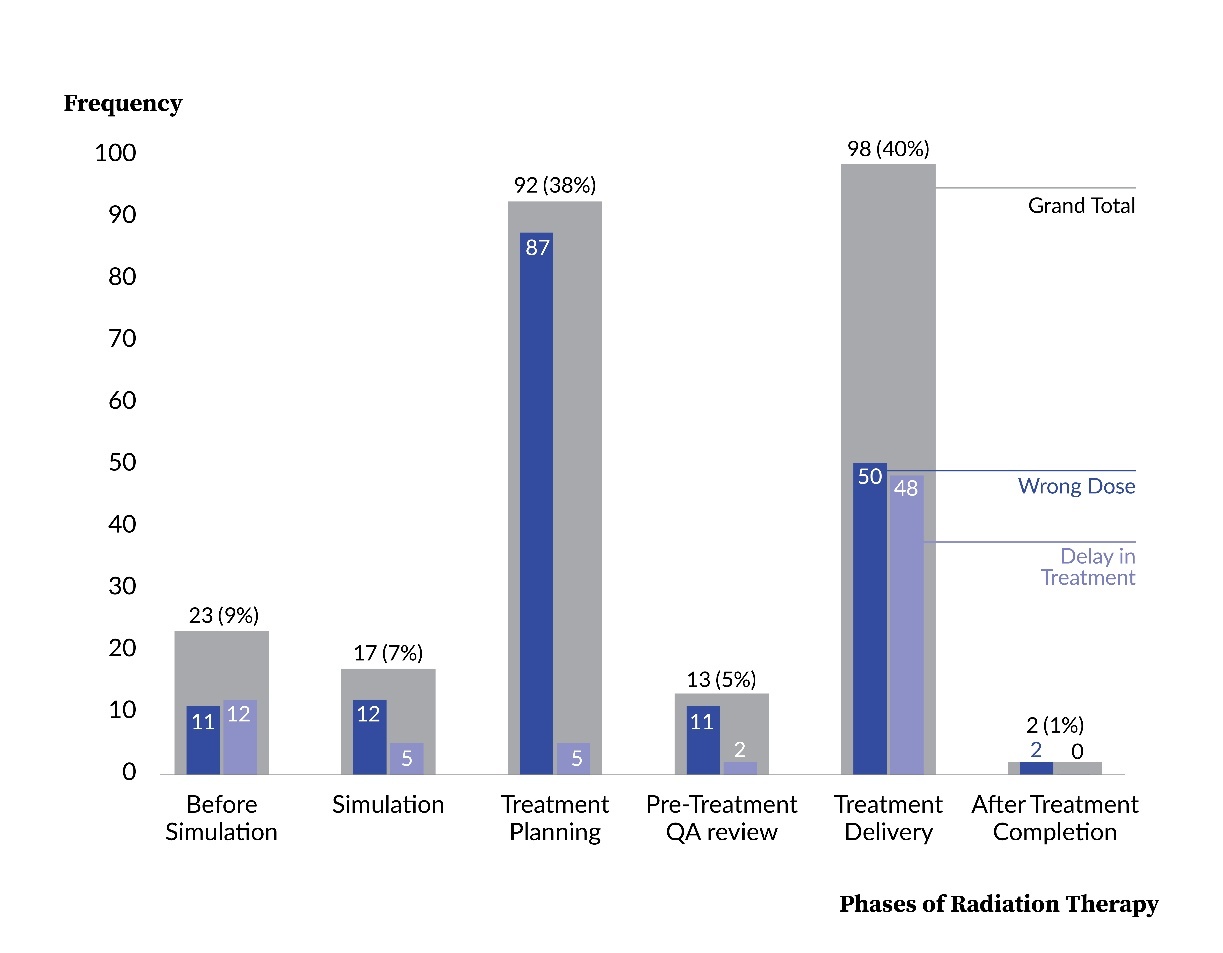
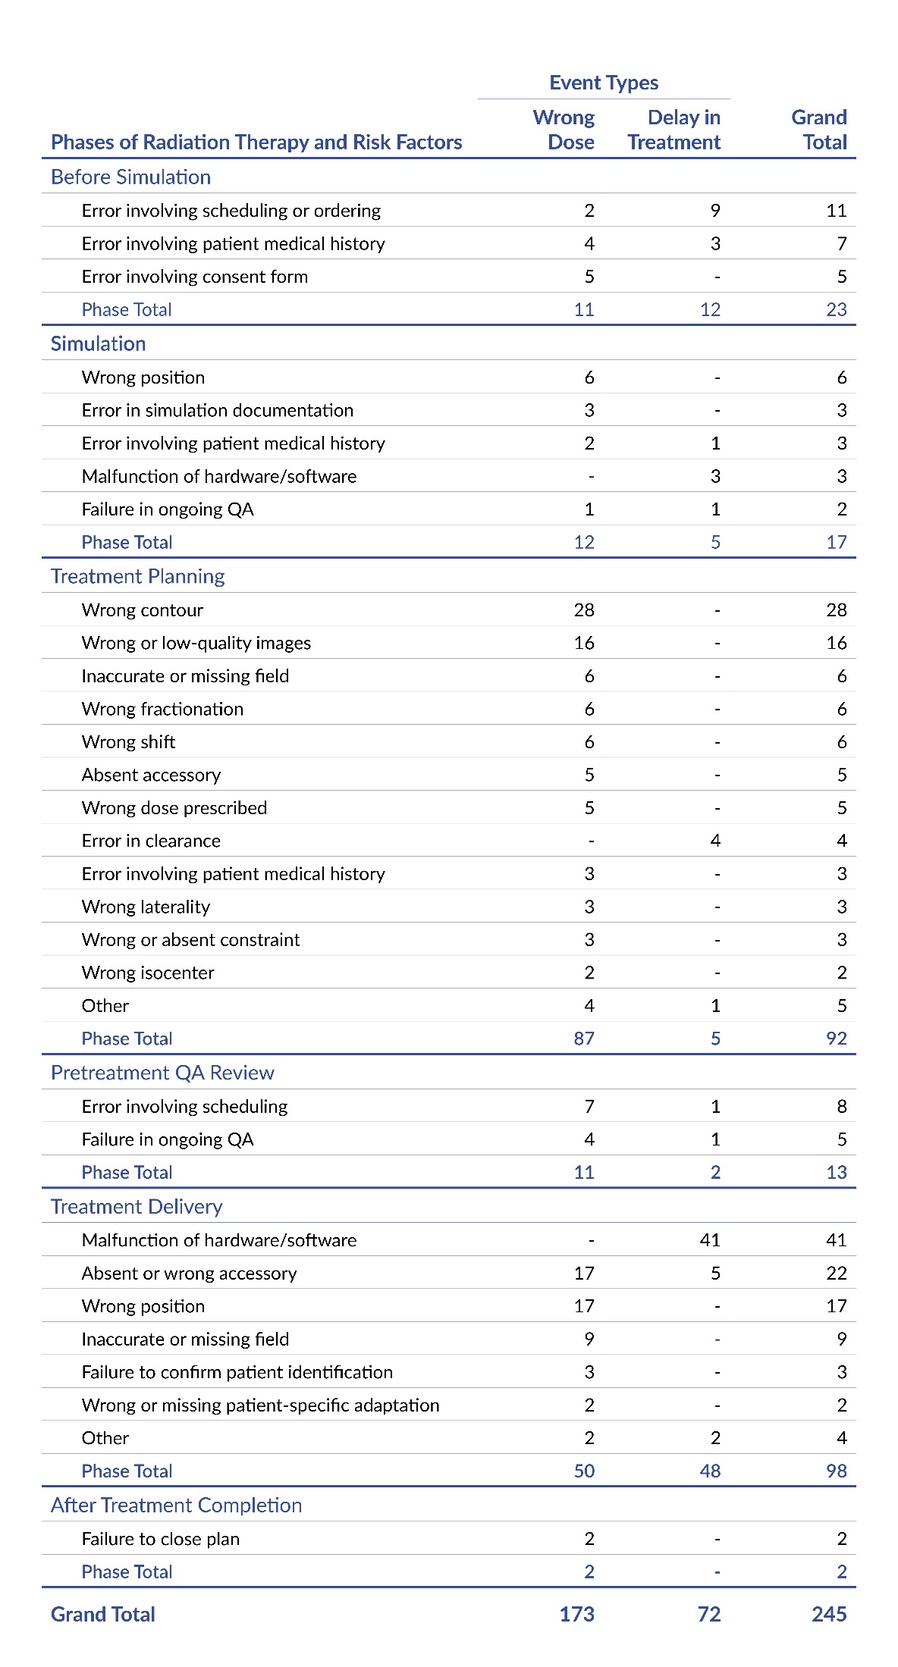
Figure 2 shows the distribution of event types by phases of RT, which represents the timing of the risk factors that acted as the impetus to the event. Across the six phases of RT, a majority of the events were related to the treatment planning phase (38%, 92 of 245) and the treatment delivery phase (40%, 98 of 245), while the fewest events were related to the after treatment completion phase (1%, 2 of 245) and the pretreatment QA review phase (5%, 13 of 245). The figure also shows that the impetus of each event type varied by phase, with a majority of the wrong dose events being attributed to the treatment planning phase (51%, 87 of 173) and a majority of the delay in treatment events being due to the treatment delivery phase (67%, 48 of 72). Overall, Figure 2 shows a strong association between the phase and both overall frequency of events and specific event types.
.jpeg)
Event Types, Phases of Radiation Therapy, and Risk Factors
Table 3 shows that the phases of RT and risk factors had varying influence on the two event types, wrong dose and delay in treatment. For example, the treatment planning phase had a notable influence on the occurrence of wrong dose events (95%, 87 of 92); however, the treatment planning phase had little relation with the delay in treatment events (5%, 5 of 92). As another example, we also found that many of the categories of risk factors had an uneven effect on the two event types. Within the treatment planning phase, 12 different categories of risk factors contributed to the occurrence of the wrong dose events, while only 2 different categories of risk factors influenced the delay in treatment events.
In contrast with the prior examples, we also found instances where the phase and risk factors had a similar influence on both event types. For example, when the risk factor occurred within the before simulation phase, a wrong dose was the result in 48% (11 of 23) of the events and a delay in treatment occurred in 52% (12 of 23) of the events. Additionally, two-thirds of the risk factor categories within the before simulation phase were associated with both the wrong dose and delay in treatment events. A further review of Table 3 will reveal additional findings where the phases and risk factors have similar or differing influence on the wrong dose and delay in treatment event types.
.jpeg)
A notable finding was related to the delay in treatment events and where the impetus was within the before simulation phase, due to an error involving scheduling or ordering. We found that in 67% (6 of 9) of these events the patients had a preventable delay of 20 or more days, with a maximum of approximately 60 days. In one of the events, the report described the patient as experiencing a total lung collapse due to the extent of tumor progression during the delay in treatment. In another event, the patient had to have their lymphoma restaged.
Wrong Dose Event Type, Whether it Reached the Patient, Phases of Radiation Therapy, and Risk Factors
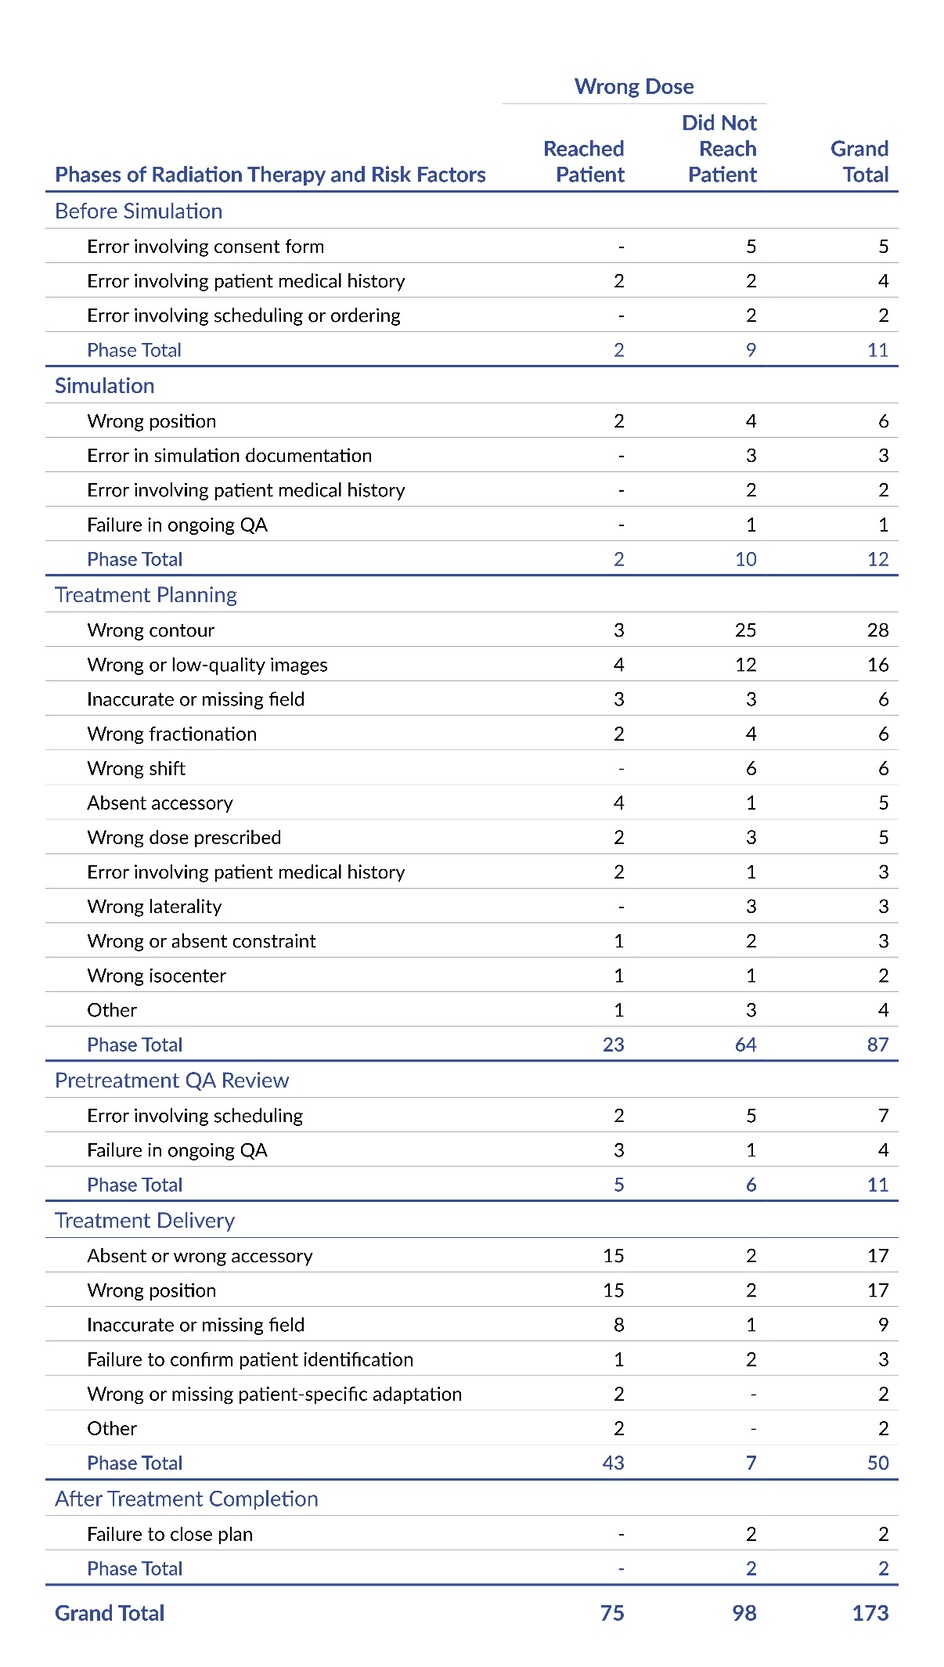
Table 4 expands upon Table 3 by showing the frequency of wrong dose events that either reached the patient or did not reach the patient, by phase of RT and risk factor. Readers should note that Table 4 relates only to the wrong dose event type because, unlike the delay in treatment event type, only a portion of the reported wrong dose events reached the patient (43%, 75 of 173). Table 4 reveals that the wrong dose events that reached the patient varied proportionally based on the phase and risk factor. For instance, when the risk factor originated in the treatment delivery phase, the wrong dose reached the patient in 86% of the reported events (43 out of 50). In contrast, when the event stemmed from the treatment planning phase, only 26% (23 out of 87) of the reported wrong dose events reached the patient.
Within each phase of RT, some risk factors were more likely to be reported as being related to a wrong dose event that reached the patient than other risk factors. For example, within the treatment planning phase, 80% (4 of 5) of the events reported as having an absent accessory resulted in a wrong dose that reached the patient, while 0% (0 of 6) of the events with a wrong shift led to a wrong dose reaching the patient. Overall, these results and others within Table 4 underscore the need to examine the risk factors in order to understand the conditions that appear to be more or less likely to lead to an event that reaches the patient.

Discussion
The present patient safety study expands upon many of the prior RT studies11,13,25–29,33–37 by analyzing the event type, whether it reached the patient, phase of RT when the risk factor originated, and risk factor (i.e., event impetus). Methodologically, the current study is comparable to several of the previous studies;11,25–29 however, there are substantial methodological differences between the current study and others that preclude comparison.13,33–37
Our study appears to have made a novel contribution to the literature by categorizing delays in treatment as a distinct event type, which was a substantial portion of the sample (29%, 72 of 245). Among the treatment delays, we found that errors during initial scheduling or ordering of RT frequently resulted in preventable treatment delays of 20–60 days in duration and posed a high potential for harm. In the present analysis, 71% (173 of 245) of the events were a wrong dose, and 43% (75 of 173) of these reached the patient, which is similar in distribution to a prior study11 and different from another.27 Readers should note that our wrong dose event type included instances where treatment was administered to the wrong site, side, or patient, as the dose was different in quantity and/or location from what was intended or appropriate.
In the current study, 38% of the events originated from the treatment planning phase and 40% were from the treatment delivery phase. These findings resemble those reported by two prior studies,11,28 but differ from another,29 which found that events relatively frequently originated from their version of the before simulation phase and simulation phase.
Among the previous research on RT patient safety events, many included a variable representing the cause or risk factor to the event.11,25,26,28,33,35,36 However, some of the studies33,35,36 used variables with categories that were broad themes (e.g., inadequate standard/procedure/practice, availability of materials/tools/equipment, personnel availability, inadequate training) and were not comparable to the more specific categories of risk factors used in the present study.
Our five most frequently coded categories of risk factors—malfunction of hardware/software (44 of 245), wrong contour (28 of 245), absent or wrong accessory (27 of 245), wrong position (23 of 245), and wrong or low-quality images (16 of 245)—were similar to those in two prior studies,11,28 but our findings diverged from two other studies.25,26 The discrepancies in the latter two studies could be attributed to several methodological differences: both studies had a relatively small sample size (110 or fewer event reports);25,26 one study was from more than 30 years ago and may have introduced selection bias into their sample;25 and the second study included events only from a single institution, restricted the sample to only those that originated from the treatment planning phase, and involved only external radiation beam therapy.26
Standout Findings: Relation Between Risk Factors and Mitigation Strategies
The greater detection of wrong dose events, prior to reaching the patient, within the treatment planning phase (87% did not reach patients, 64 of 87), when compared with the treatment delivery phase (14% did not reach patients, 7 of 50) highlights a fundamental issue: There are fewer and less effective checks for treatment delivery than for treatment planning in the field of RT.38 Real-time verification during treatment delivery remains a challenge; therefore, enhanced time-out procedures and automation that specifically address accessories and positioning likely would improve treatment accuracy.39 In events that described spine treatments with vertebral body identification errors (i.e., wrong position errors), we anticipate that mandatory cone beam computed tomography (CBCT) could prevent wrong-site treatments;40 however, this would increase treatment time and imaging dose.
The extensive treatment delays caused by scheduling or ordering errors in the before simulation phase represent a challenge that was primarily caused by workflow and communication failures, such as the referral not being sent or being sent to the wrong scheduling pool, or order for treatment to the wrong side of the body. As an example, the delays in scheduling and ordering with the RT department may have also led to insurance authorization delays, a need for reimaging (e.g., MRI for risk of metastasis), delayed coordination between radiation therapy and chemotherapy, further metastasis of cancer, and greater complexity of and potentially less effective treatment. Automated tracking systems are a potential solution,41 but implementation would require integration across multiple departments and often involves asynchronous software platforms, which can require substantial resources to execute.
The events that described a treatment delay and were caused by a malfunction of hardware/software (44 of 72) likely could have been prevented by using redundancy in planning, which many facilities may lack.42 Our data suggest that having preassigned backup linear accelerators (linacs) and formal downtime protocols could prevent most of these treatment delays. Some institutions have reported success with predictive maintenance systems,43,44 although the initial investment may be prohibitive for facilities with limited resources.
Prioritization of Risk Factors and Mitigation Strategies
We recommend readers use the risk factors identified in this study, along with other studies11,25,26,28 and those from their incident learning system (ILS), to guide intervention within their organization. See Online Supplement Appendix S1 for a list of mitigation strategies to help detect and prevent the risk factors identified in the present study. The list of strategies were primarily derived from prior literature that had varying levels of evidence, including expert opinion.45 When readers review Appendix S1, we urge them to critically evaluate these strategies prior to their implementation. To support the individualized prioritization of risk factors and strategies outlined in Appendix S1, we recommend readers consider the following variables and approaches/tools.
-
Risk factor–related variables: Frequency or likelihood of risk factor occurrence, amount of risk associated with one factor when compared to another, severity of harm caused by the risk factor, and detectability of the risk factor.
-
Strategy-related variables: Impact of strategy, high/low-leverage strategy, risk of unintended outcome and degree of harm associated with unintended outcome, effort/feasibility to implement and maintain the strategy, resources and cost associated with strategy, return on investment/value, and whether the strategy aligns with a strategic plan. Readers should note that RT is a complex system where small changes in part of the process can ripple through the entire system.
-
Approaches/tools: Pareto analysis of risks, risk assessment matrix, Kano model for risks, pairwise comparison of risks or strategies, weighted scoring model of strategies (i.e., solution selection matrix), strategic alignment mapping, and impact effort matrix for strategies.
Limitations
Many of the event reports did not provide sufficient information to determine the anatomical site being treated, specific type of simulation or RT, whether the dose was delivered beyond the planned margin (i.e., wrong site), or the extent of dose deviation from what was prescribed or intended. This information would allow for comprehensive comparisons with previous research and help pinpoint the variables that led to greatest risk of patient harm.
Due to insufficient detail in many of the event reports, it was not possible to reliably determine the causal factors underlying each event. As a result, we coded for risk factors, which were the variables that were the impetus and influenced, or likely influenced, the occurrence of each event. Furthermore, the event reports often lacked necessary information to determine the broader contributory themes, such as deficiencies in standard/procedure/practice, training, communication, or organizational management.
Two of the 40 facilities contributed 43% (106 of 245) of the event reports in this study, which may have introduced potential bias into the distribution of the results. Nonetheless, we chose to include all events that met inclusion criteria rather than using a selection method to reduce the proportional representation of those two facilities within our results. We made this choice because the exclusion of reports from these two facilities could remove valuable data not captured by other facilities. Overall, we prioritized conducting an analysis of the complete dataset over balancing the distribution of event reports across facilities.
Finally, readers should not interpret these findings as the absolute frequency of RT events in Pennsylvania, as underreporting to PA-PSRS is likely, despite mandated reporting. Given this limitation and the unreliability of available treatment data, we elected not to calculate a potentially misleading RT event rate.
Conclusion
Our analysis of 245 radiation therapy events identified 23 distinct risk factors across six phases of RT, each contributing to either wrong dose or delay in treatment events. The majority of the events resulted in a wrong dose event type (71%), while a sizeable portion led to a delay in treatment (29%). As shown in Table 3, the distribution of event types varied depending on the phase and associated risk factors. For instance, over half (51%) of the wrong dose events originated from the treatment planning phase and a majority (67%) of the delay in treatment events were associated with the treatment delivery phase. As another example, within the treatment planning phase, 12 categories of risk factors contributed to wrong dose events, compared to only two categories leading to treatment delays, illustrating the differential influence of risk factors on event types. The collective results underscore the need to examine the risk factors in order to understand the conditions that appear to be more or less likely to lead to a wrong dose and/or delay in treatment.
As a standout finding, the study showed that wrong dose events were frequently related with accessory and positioning issues during the treatment delivery phase, which indicates that real-time verification during treatment delivery is a notable challenge. This finding suggests that enhanced time-out procedures and automation likely would improve treatment accuracy. As another standout finding, we found that lengthy treatment delays were frequently attributed to scheduling or ordering errors in the before simulation phase. These workflow and communication failures likely could be addressed by implementing automated tracking systems. Given the complexity and nuanced nature of RT, we developed Online Supplement Appendix S1, which provides a list of mitigation strategies aimed at detecting and preventing the risk factors identified in the present study. The objective of Appendix S1 is to serve as a resource to facilitate intervention and reduce patient harm in radiation therapy.
Notes
This analysis was exempted from review by the Advarra Institutional Review Board.
Data used in this study cannot be made public due to their confidential nature, as outlined in the Medical Care Availability and Reduction of Error (MCARE) Act (Pennsylvania Act 13 of 2002).46
Artificial intelligence was used only to improve sentence clarity. No AI was used for data analysis, interpretation, or generation of original content. The authors take full responsibility for the accuracy and integrity of the manuscript.
Disclosure
The authors declare that they have no relevant or material financial interests.
About the Authors
Matthew A. Taylor (MattTaylor@pa.gov) is a research scientist on the Data Science & Research team at the Patient Safety Authority, where he conducts research, uses data to identify patient safety concerns and trends, and develops solutions to prevent recurrence.
Scott Symington (ssymington@wellspan.org) is a senior medical physicist at WellSpan Radiation Oncology in Chambersburg, Pennsylvania. His expertise includes radiation oncology, healthcare quality, quality assurance, and program development.
Mohammad Bakhtiari (mbakhtiari@wellspan.org) is a senior medical physicist at WellSpan Radiation Oncology in Chambersburg, Pennsylvania. His expertise includes radiation oncology, healthcare quality, patient safety, AI applications, and systems improvement. His research surrounds practical solutions for complex healthcare systems.
PA-PSRS is a secure, web-based system through which Pennsylvania hospitals, ambulatory surgical facilities, abortion facilities, and birthing centers submit reports of patient safety–related incidents and serious events in accordance with mandatory reporting laws outlined in the Medical Care Availability and Reduction of Error (MCARE) Act (Act 13 of 2002). All reports submitted through PA-PSRS are confidential and no information about individual facilities or providers is made public.
The query of PA-PSRS explored four free-response fields in the event reports for one or more of the following 67 keywords: “radiation oncolog,” “rad onc,” “radiation onc,” “rad oncolog,” “radiation treatment,” “rad treatment,” “radiation tx,” “rad tx,” “radiation therap,” “rad therap,” “radiotherapy,” “external Beam radiation,” “ebrt,” “brachytherapy,” “seed,” “contour,” “treatment planning,” " delineation," “organ at risk,” “organs at risk,” “oar,” “isocent,” “megavoltage,” “electron therap,” “electron treatment,” “photon therap,” “photon treatment,” “proton therap,” “proton treatment,” “dosimetr,” “laterality,” “wrong side,” “wrong site,” “wrong patient,” “wrong name,” “wrong procedure,” “wrong treatment,” “wrong therapy,” “ptv,” “ctv,” “itv,” “breath hold,” “motion management,” “setup,” “shifted,” “fiducial,” “sbrt,” “srs,” “stereotactic,” “radiation field,” “fraction,” “irradiat,” “tbi,” “reference point,” “physics,” “physicist,” “gamma knife,” “cylinder,” “hdr,” “simulation,” “sim order,” “electron block,” “field weighting,” “accelerator,” “simulator,” “collimat,” and “margin.”