


Introduction
The Pennsylvania Patient Safety Reporting System (PA-PSRS) is the largest patient safety data repository of its kind in the United States and one of the largest globally, encompassing more than 5.8 million reports submitted through the end of 2025. Of these, over 5.3 million are housed in the acute care database, comprising reports from acute and ambulatory healthcare facilities[1]. In this article, we present data from reports submitted to the PA-PSRS acute care database in 2025 and offer comparisons to prior years and meaningful insights to highlight potential areas of interest.
Definitions
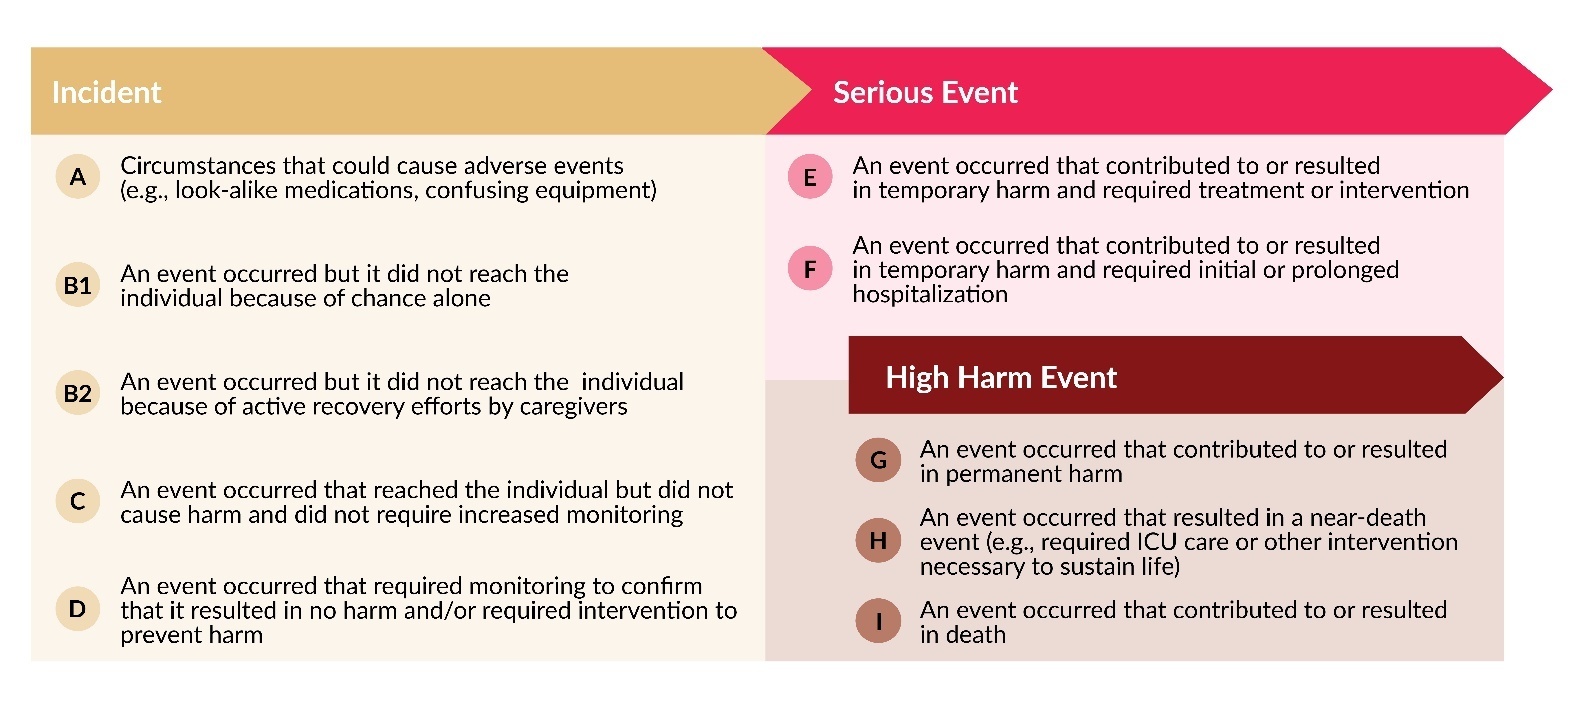
While many terms are commonly used interchangeably to describe the occurrence and severity of patient safety events, in the context of this manuscript they hold distinct meanings and indications for reporting to PA-PSRS under the Medical Care Availability and Reduction of Error (MCARE) Act (Act 13 of 2002).1 As defined in MCARE, an “incident” is “an event, occurrence, or situation involving the clinical care of a patient in a medical facility which could have injured the patient but did not either cause an unanticipated injury or require the delivery of additional healthcare services to the patient,” and a “serious event” is “an event, occurrence, or situation involving the clinical care of a patient in a medical facility that results in death or compromises patient safety and results in an unanticipated injury requiring the delivery of additional healthcare services to the patient.”1
Each event report includes a harm score, assigned by the reporting facility, which indicates the potential or actual harm to the patient resulting from the event. Table 1 provides the definitions for each harm score, as well as the groupings for incidents, serious events, and high harm events.
Methods
This analysis was conducted using data extracted from the PA-PSRS acute care database[2] on February 1, 2026, along with data from the Pennsylvania Health Care Cost Containment Council (PHC4)[2]. Report counts are based on the date the report was submitted, while reporting rates are calculated using the event occurrence date to be in line with the occurrence of patient days or surgical encounters used in the denominator of the rate calculations. Rates are expressed per 1,000 patient days for hospitals and per 1,000 surgical encounters for ambulatory surgical facilities (ASFs). At the time of this analysis, PHC4 data was available through Q2 2025, necessitating the calculation of preliminary 2025 rates using only the first two quarters of PA-PSRS data. To add perspective to preliminary versus final rates, over the prior three years, the preliminary rates using the first two quarters were on average 1.43% and 2.88% lower than the subsequently published final rates for hospitals and ASFs, respectively.
Results
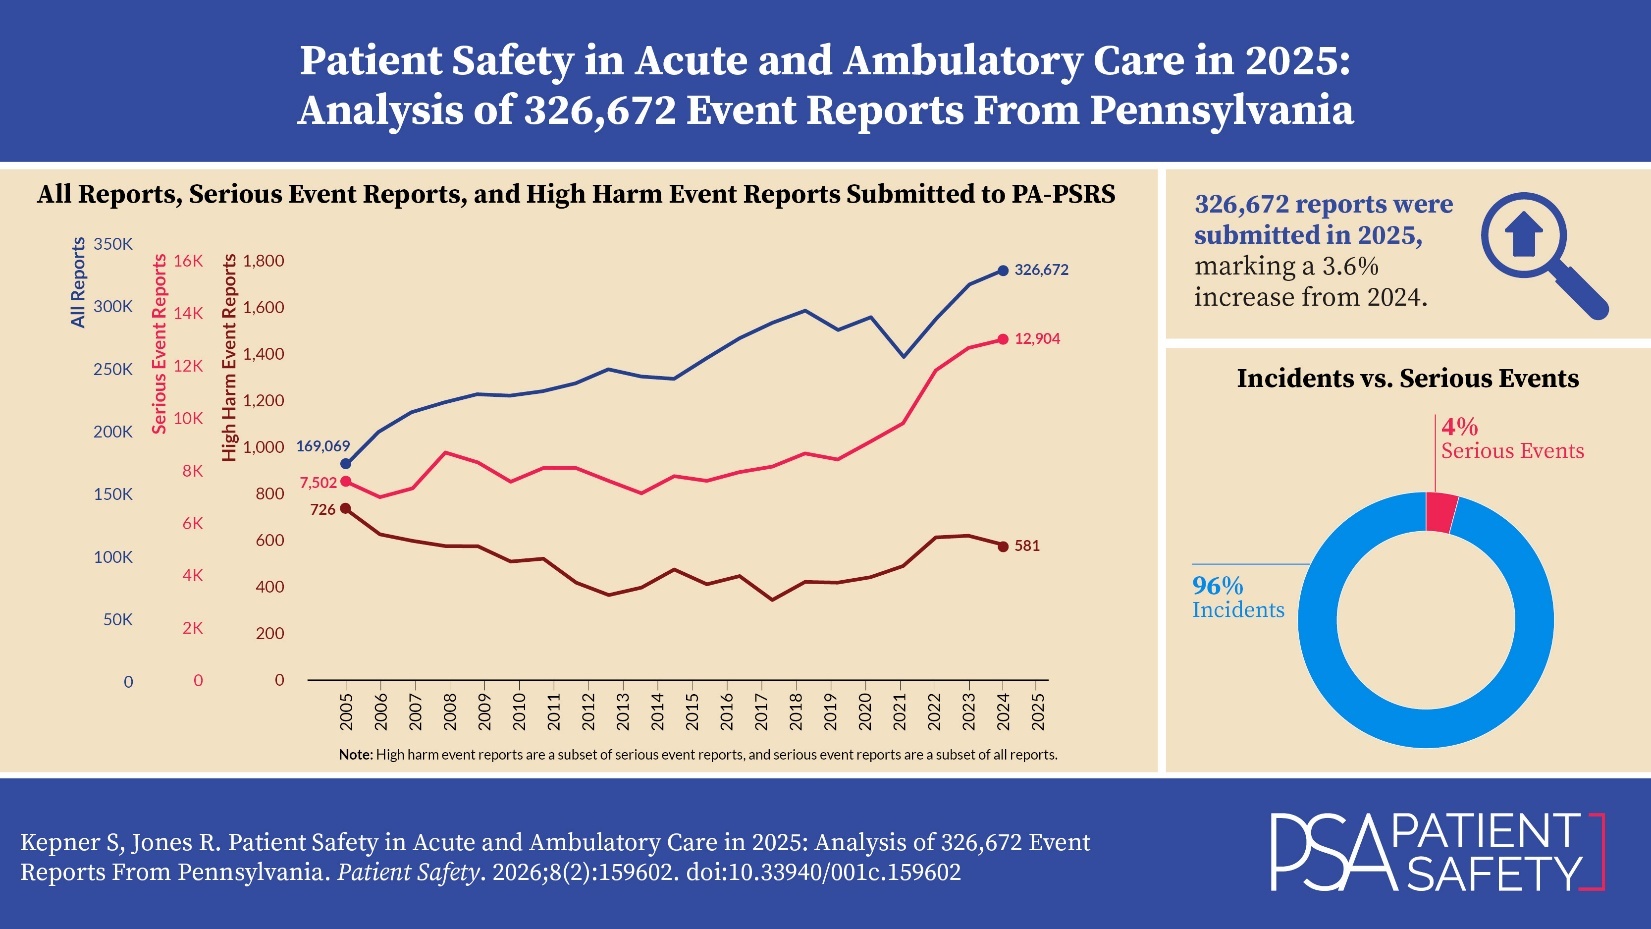
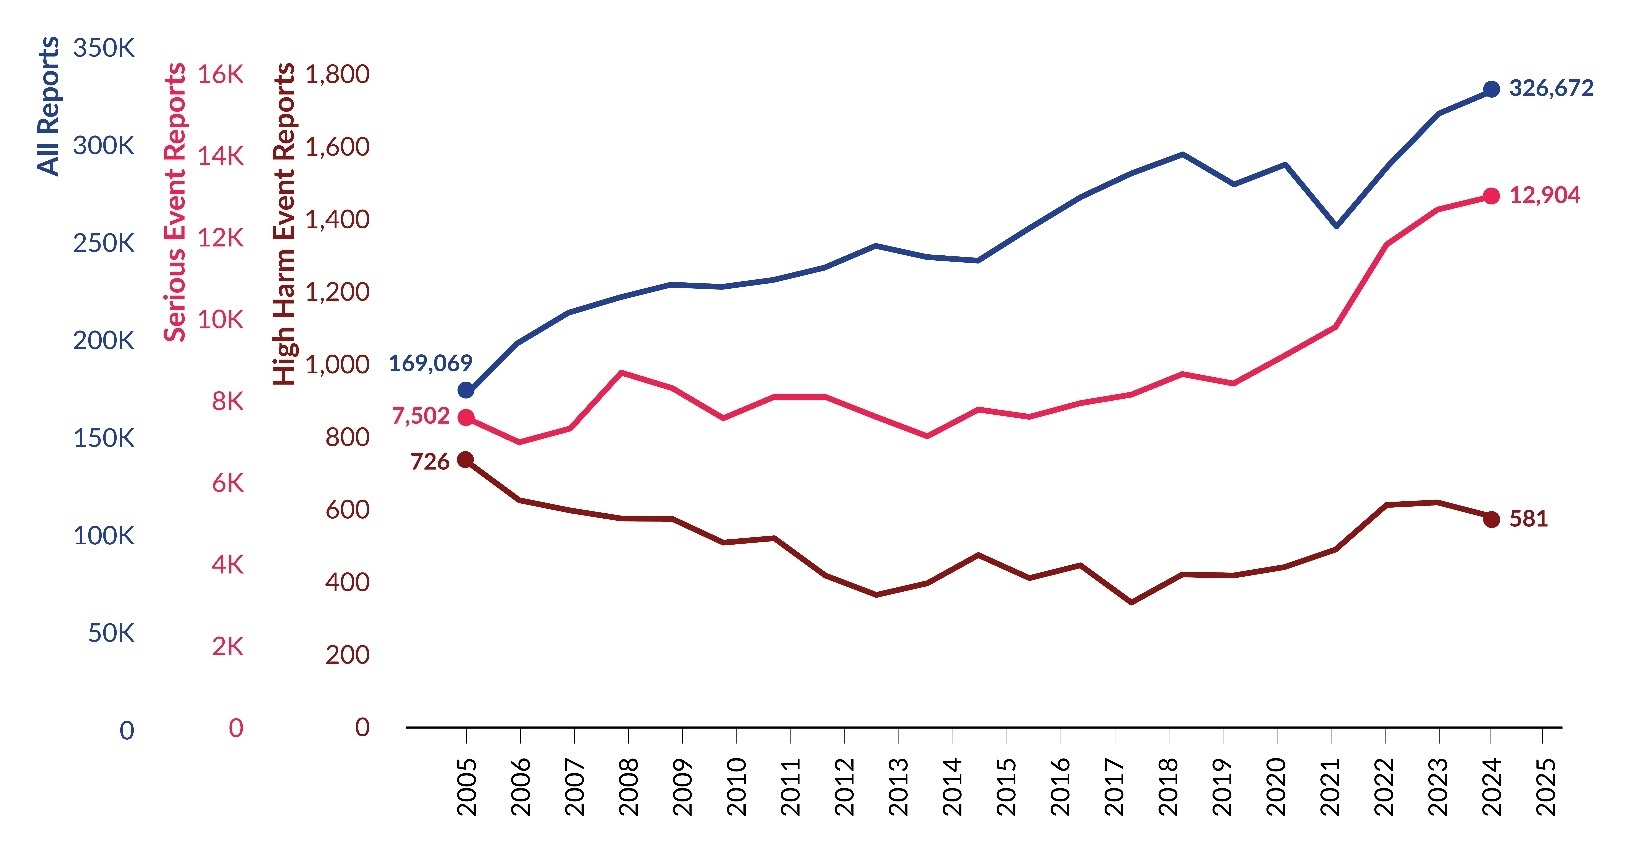
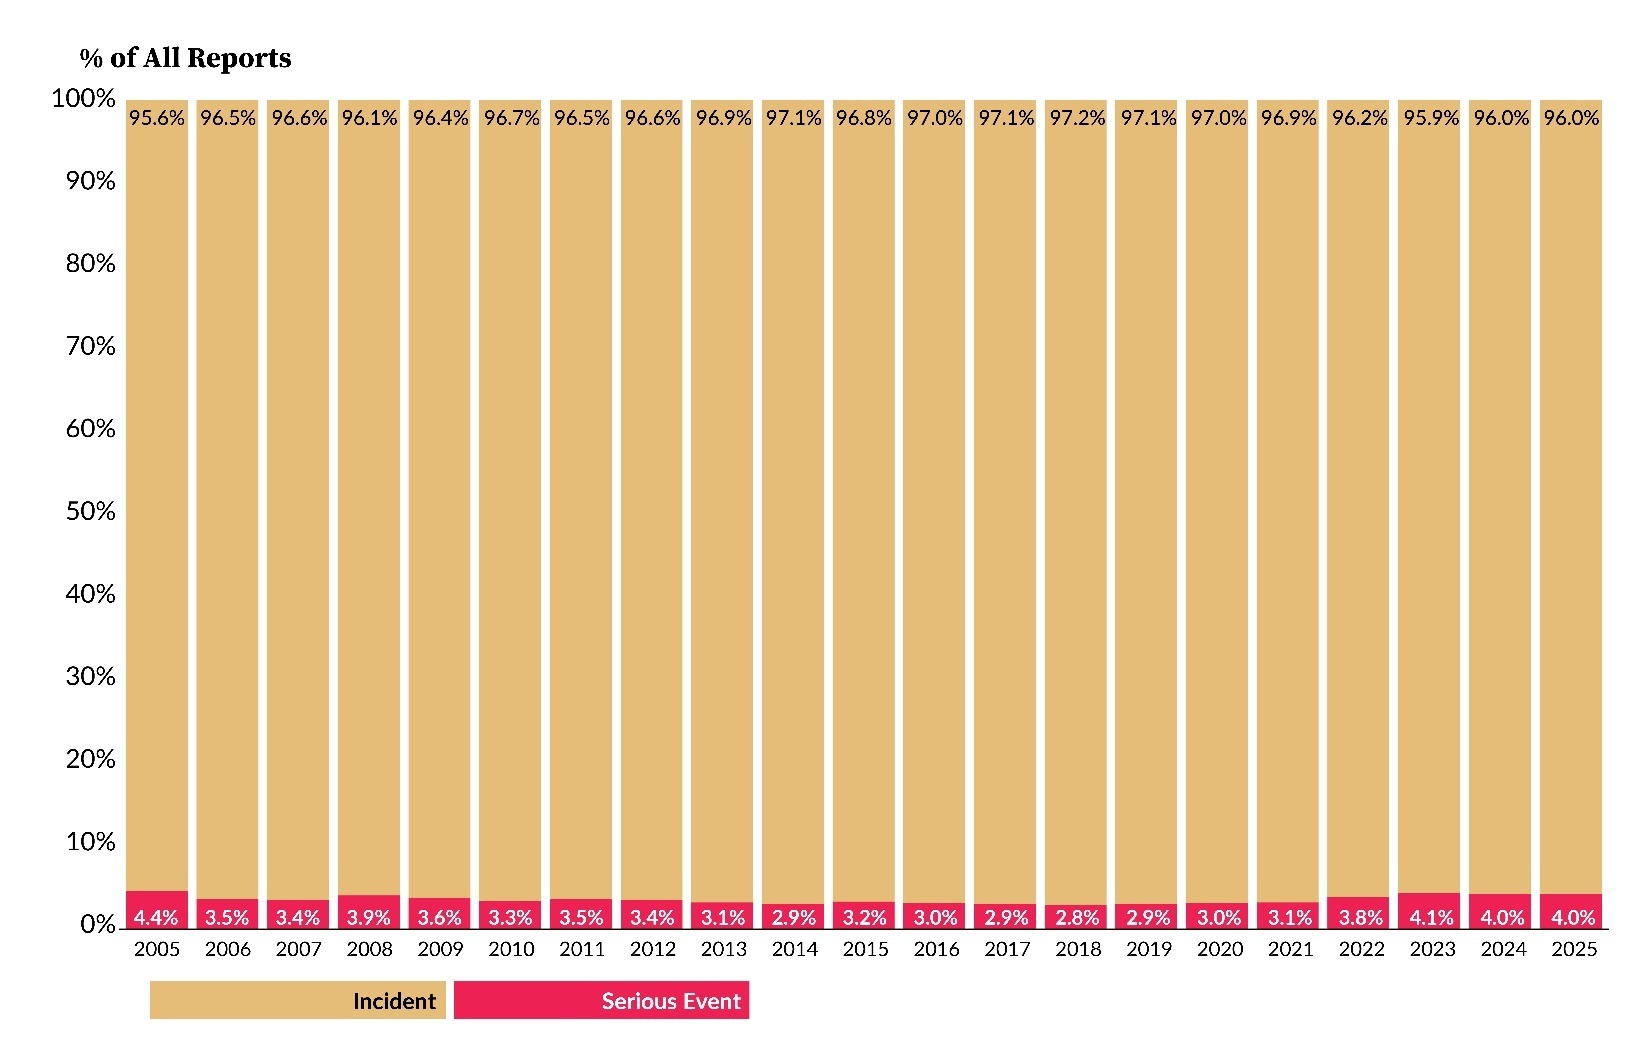
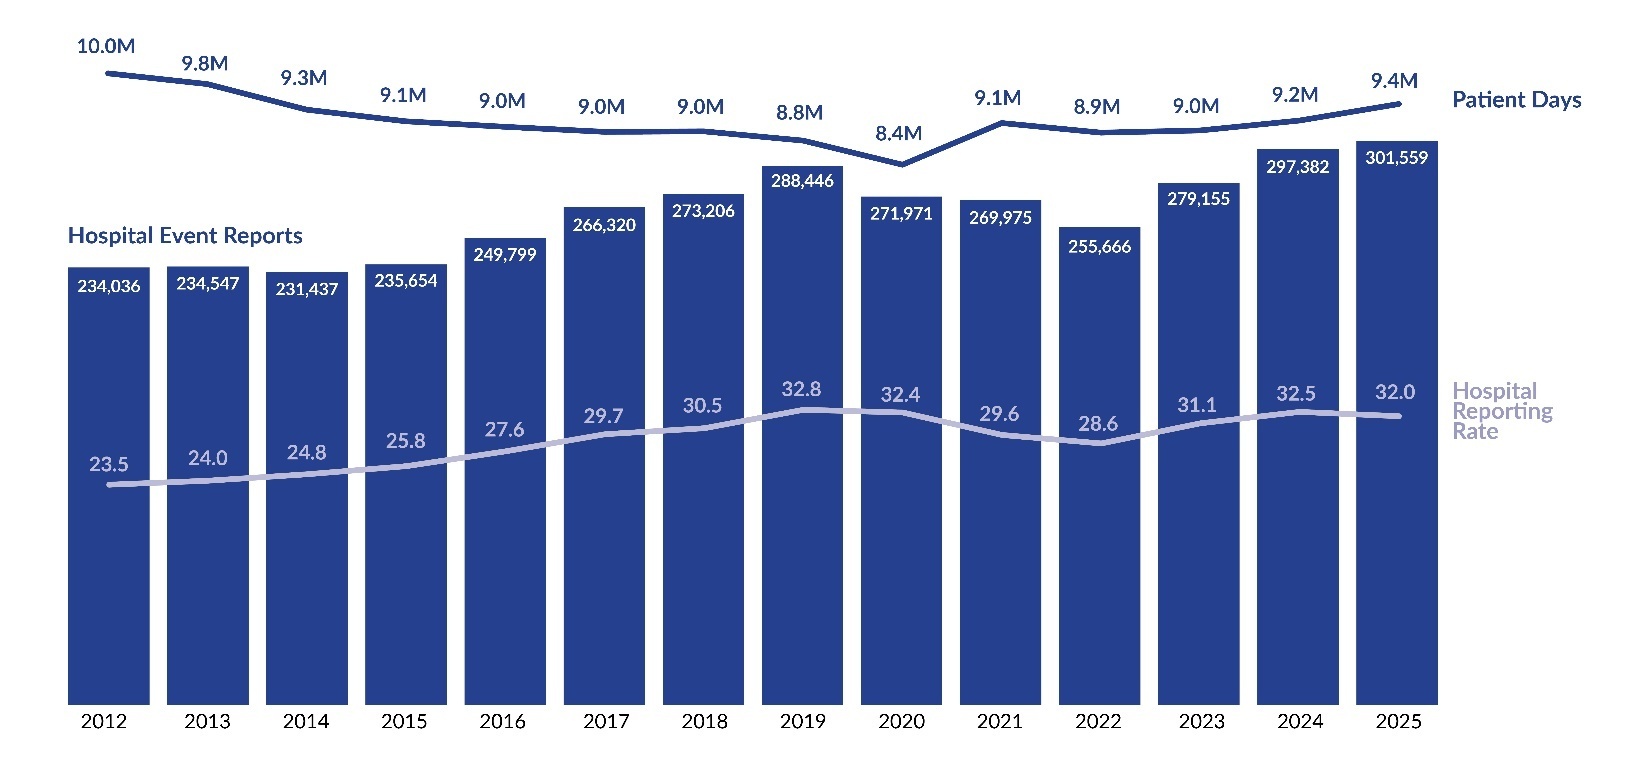
As shown in Figure 1, 326,672 reports were submitted in 2025, marking a 3.6% increase (11,257 additional reports) compared to 2024[3]. Of the 326,672 reports in 2025, 12,904 were serious events, with 581 identified as high harm. The number of serious event reports increased by 2.4% from 2024, while high harm events within this group decreased by 5.8%. Figure 2 illustrates the proportion of incidents and serious events within all reports. In 2025, 4.0% of reports were classified as serious events, the same percentage as 2024.


Table 2 shows a breakdown of incidents and serious events by facility type submitted over the past three years. From 2024 to 2025, the number of reports submitted by hospitals increased by 12,172 (4.0%), and reports from nonhospital facilities (i.e., ASFs, birthing centers [BRCs], and abortion facilities [ABFs]) decreased by 915 (-7.2%).
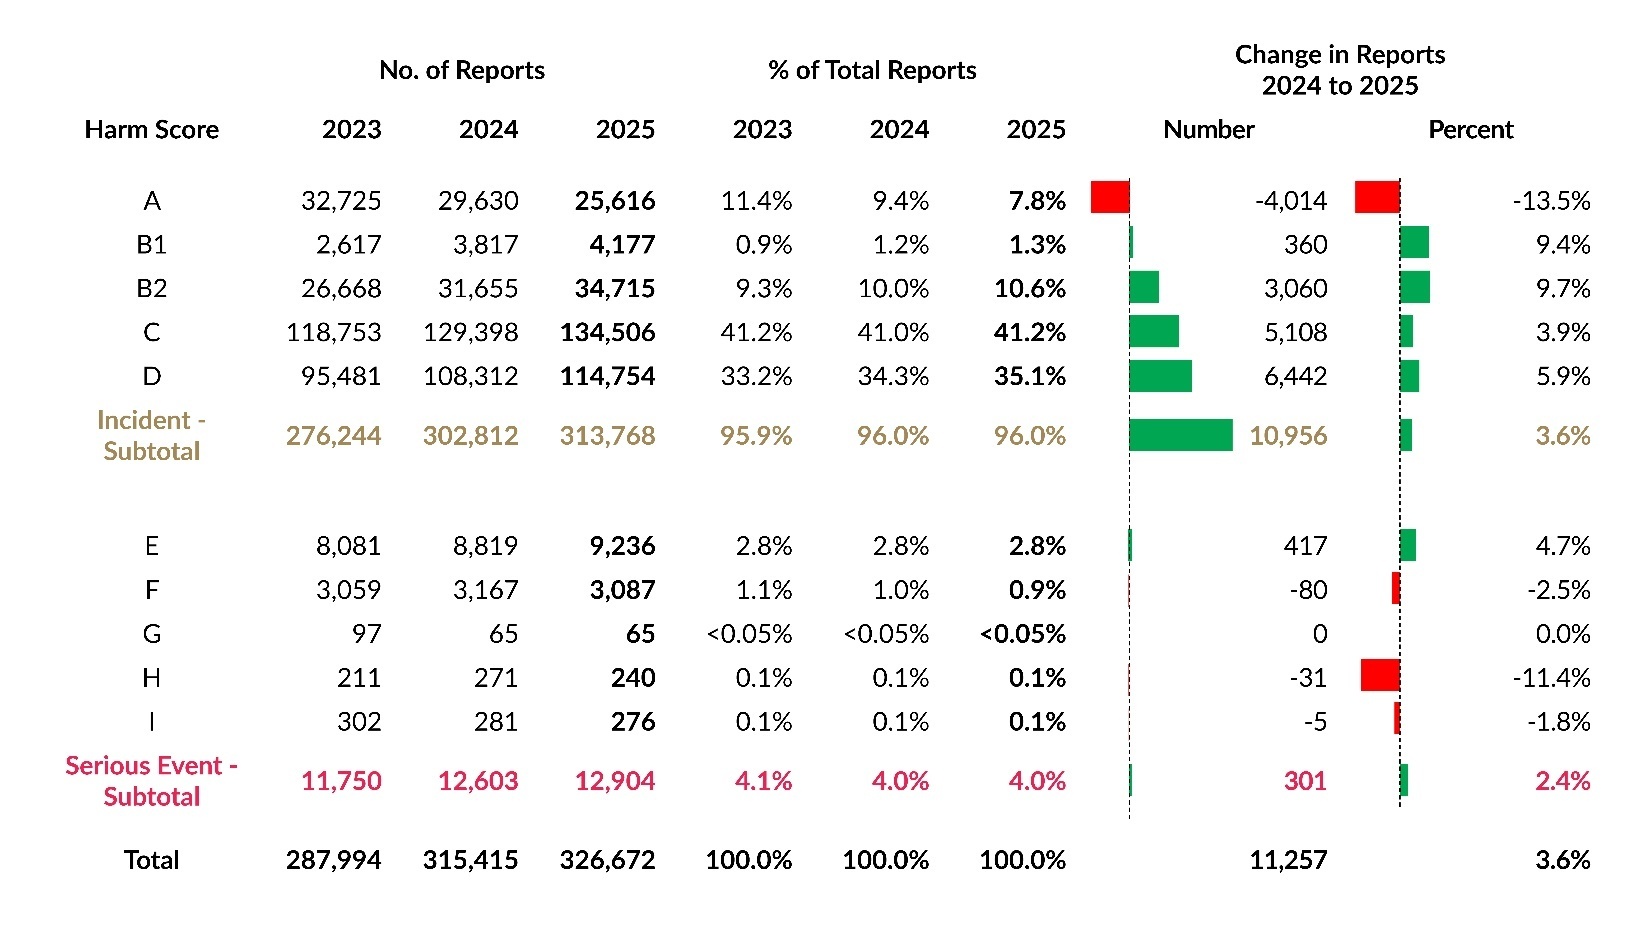
Table 3 displays harm score distributions for reports submitted over the past three years. While harm score C remained the most common classification in 2025, harm score D showed the largest increase in number. Harm score B2 had the largest percentage increase, rising by 9.7%. The largest decrease, both in number and percentage, occurred with harm score A, which also had the largest numerical decrease in 2024.

Reporting Rates Based on Event Occurrence Date
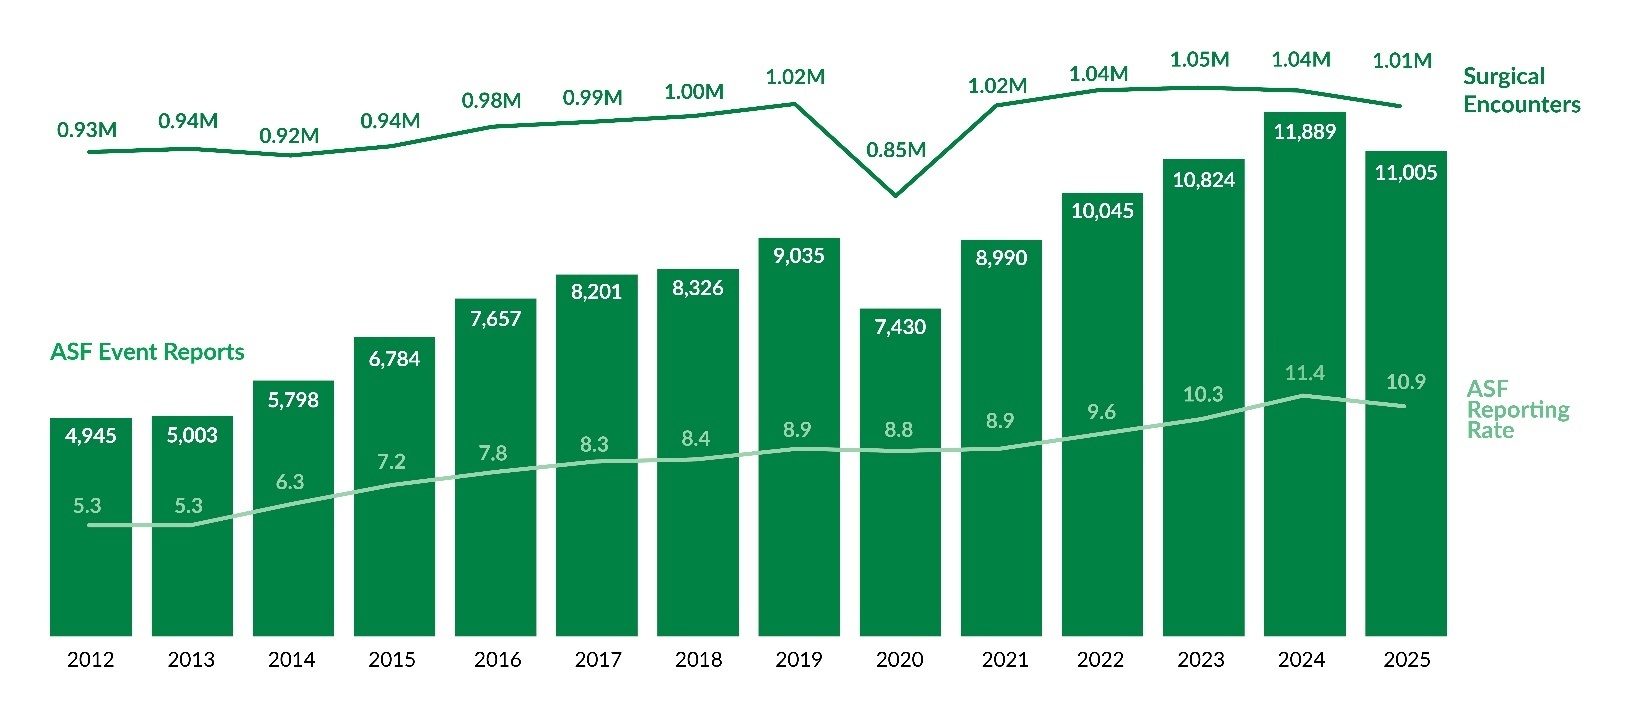
Unlike raw report counts, reporting rates provide a standardized measure for comparison over time. As shown in Figure 3, the preliminary hospital reporting rate for Q1–Q2 of 2025 is 32.0 reports per 1,000 patient days, 0.5 points lower than the full-year 2024 rate. Similarly, Figure 4 indicates that the preliminary ASF reporting rate for 2025 is 10.9 reports per 1,000 surgical encounters, marking the first rate decrease since 2020.

Event Types
Each PA-PSRS report includes an event type and subtype(s) that are assigned by the reporting facility. Table 4 shows the number and percentage of all reports submitted for each main event type from 2021 to 2025. Over the past five years, the most frequently reported event type has been Error Related to Procedure/Treatment/Test (P/T/T), with 104,841 reports submitted in 2025, accounting for 32.1% of all reports. From 2024 to 2025, the largest increase in number of reports by event type was for Medication Error, which rose by 3,915 reports. When looking at percentage growth, Equipment/Supplies/Devices had the highest increase, up 26.6% (from 11,689 to 14,798 reports). The Fall event type showed the greatest decrease in number of reports, dropping by 1,362, and Patient Self-Harm decreased the most percentagewise (-6.2%).
Table 5 shows the number and percentage of serious event reports submitted for each main event type from 2021 to 2025. Over the past five years, Complication of P/T/T has been the most frequently reported serious event type, and in 2025 it accounted for 55.4% of all serious event reports. From 2024 to 2025, Other/Miscellaneous had the largest increase in number of serious event reports, rising by 277, and Complication of P/T/T decreased the most, by 31 reports.
Event Subtypes
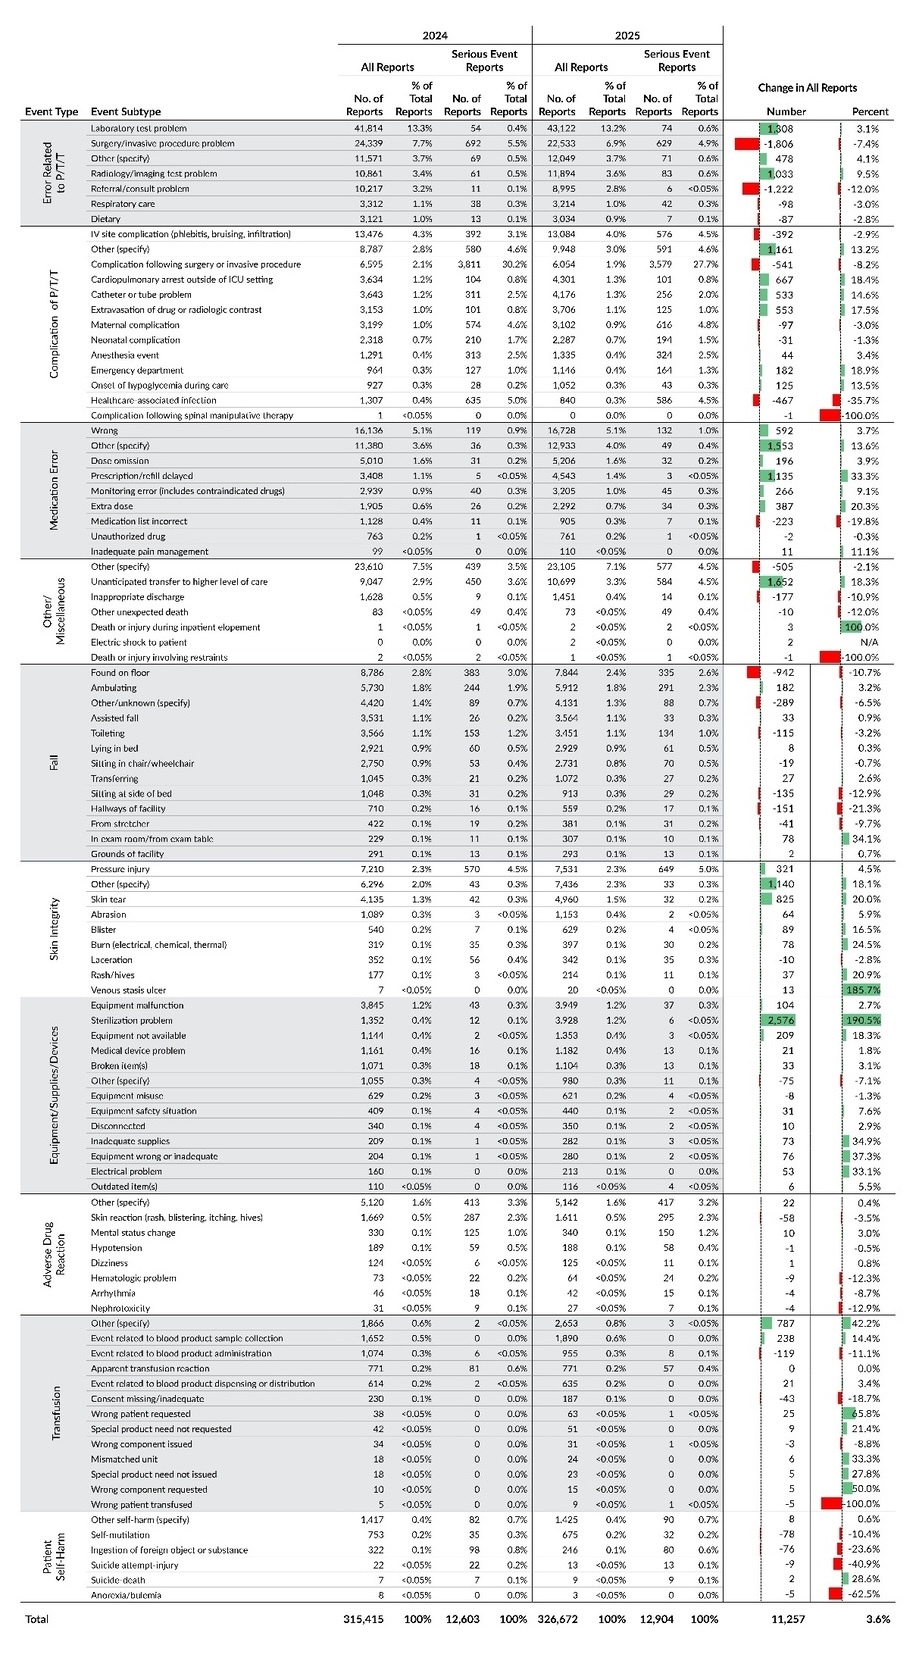
Each of the 10 main event types is further classified into subtypes. Table 6 provides a detailed breakdown of all reports and serious event reports, along with their percentage distributions, based on the first level subtypes for each main event type.
The event subtype with the largest increase in number of submitted reports from 2024 to 2025 was Equipment/Supplies/Devices – Sterilization problem, which rose by 2,576 reports—a 190.5% increase, the largest percentage change among all subtypes. Further analysis indicates that this was primarily associated with a single facility, which accounted for more than three-quarters of the increase. The second largest increase was observed in the event subtype Other/Miscellaneous – Unanticipated transfer to higher level of care, which rose by 1,652 reports (18.3%) and reflected changes across multiple facilities rather than a single site. The second largest percentage increase occurred in Skin Integrity – Venous stasis ulcer, which rose 185.7% from 7 reports in 2024 to 20 in 2025; however, over half of the reports contributing to this increase described events inconsistent with venous stasis ulcers. Given this inconsistency and the low baseline, the large percentage change reflects low counts and inconsistent reporting rather than a true statewide increase in venous stasis ulcer events.
The event subtypes with the two largest decreases in number of reports from 2024 to 2025 are both within the main event type Error Related to P/T/T: Surgery/invasive procedure problem decreased by 1,806 reports, and Referral/consult problem decreased by 1,222 reports.

Event Type and Harm Score
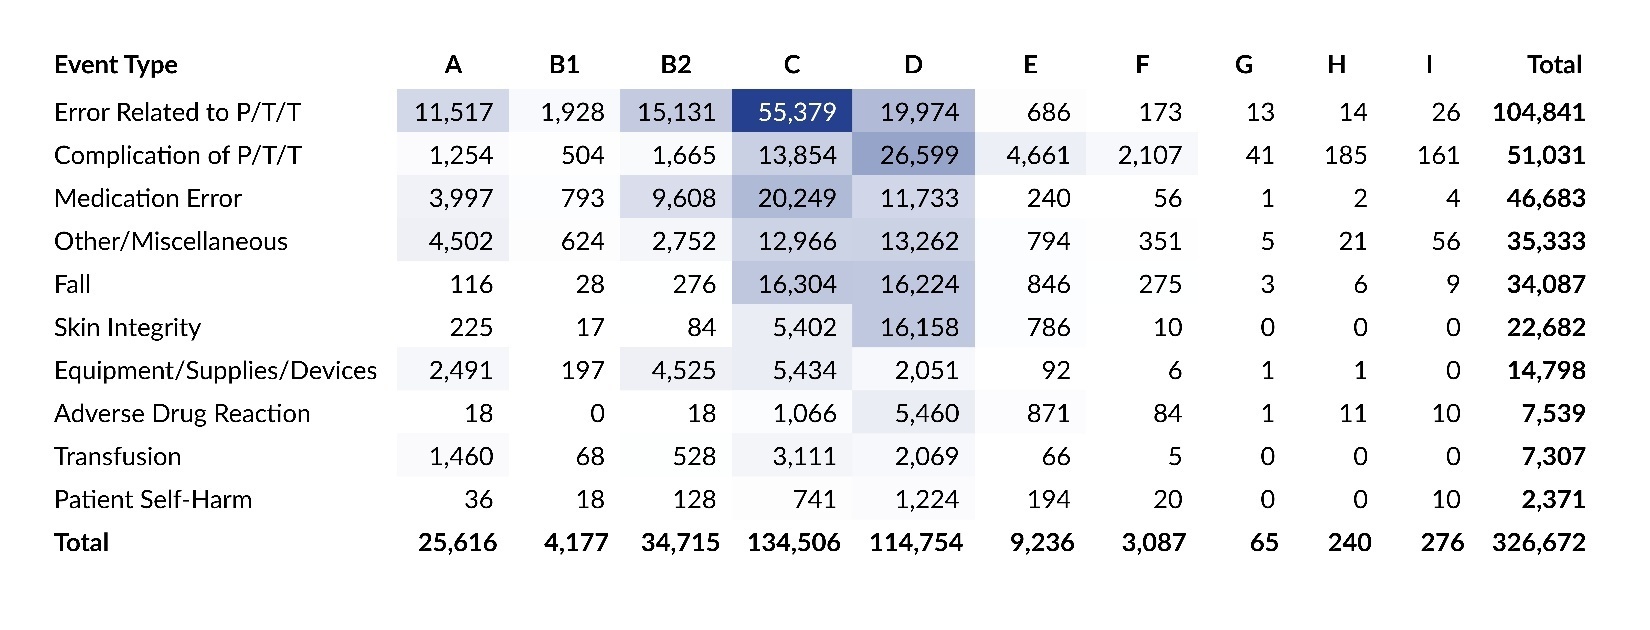
Table 7 presents a cross tabulation of submitted reports by harm score for each of the 10 main event types. The colored cells highlight the most common intersections of event type and harm score in 2025, with darker shades indicating higher concentrations of reports. The table reflects the same two areas of highest concentration that were seen in the data from the prior two years—cross sections of Error Related to P/T/T and harm score C, along with Complication of P/T/T and harm score D—which together account for a quarter of all reports in 2025. Individually, the intersection of Error Related to P/T/T and harm score C represented 17.0% of all reports, and Complication of P/T/T and harm score D represented 8.1% of all reports. Also, over half (52.4%) of all serious events in 2025 were categorized as Complication of P/T/T with harm scores E and F.
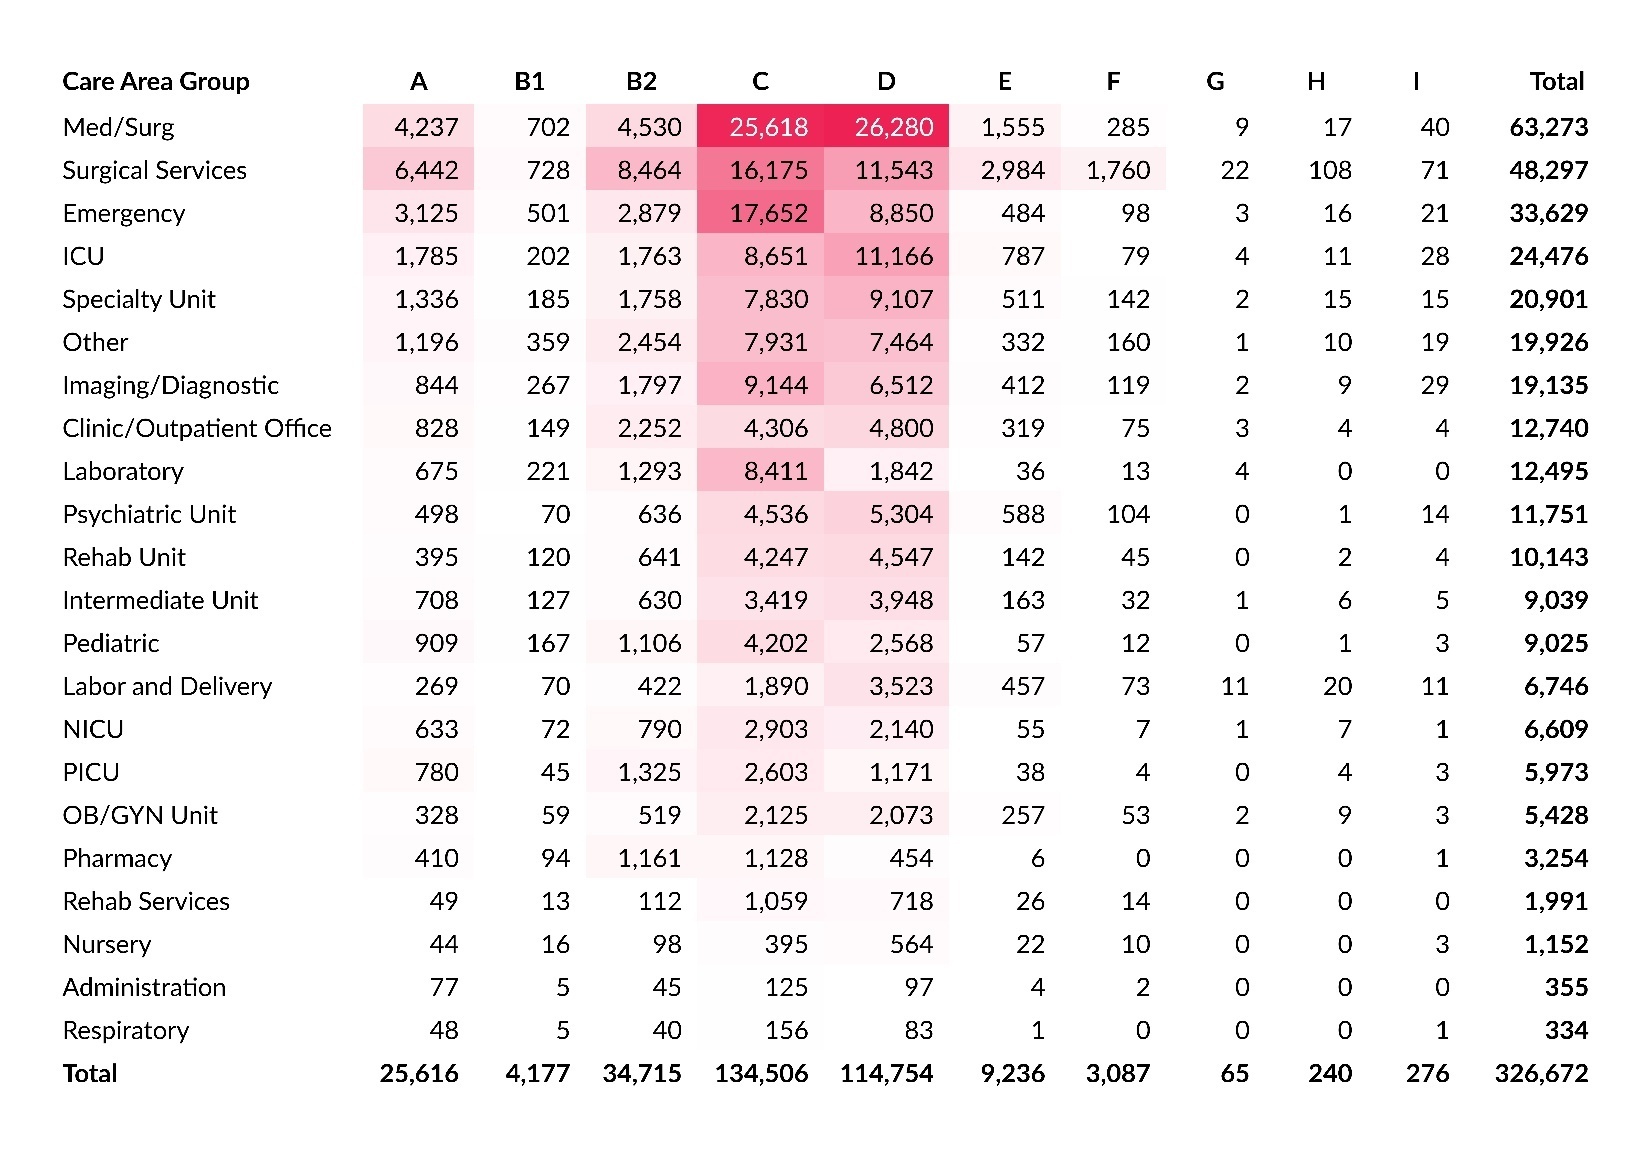
Care Area and Harm Score
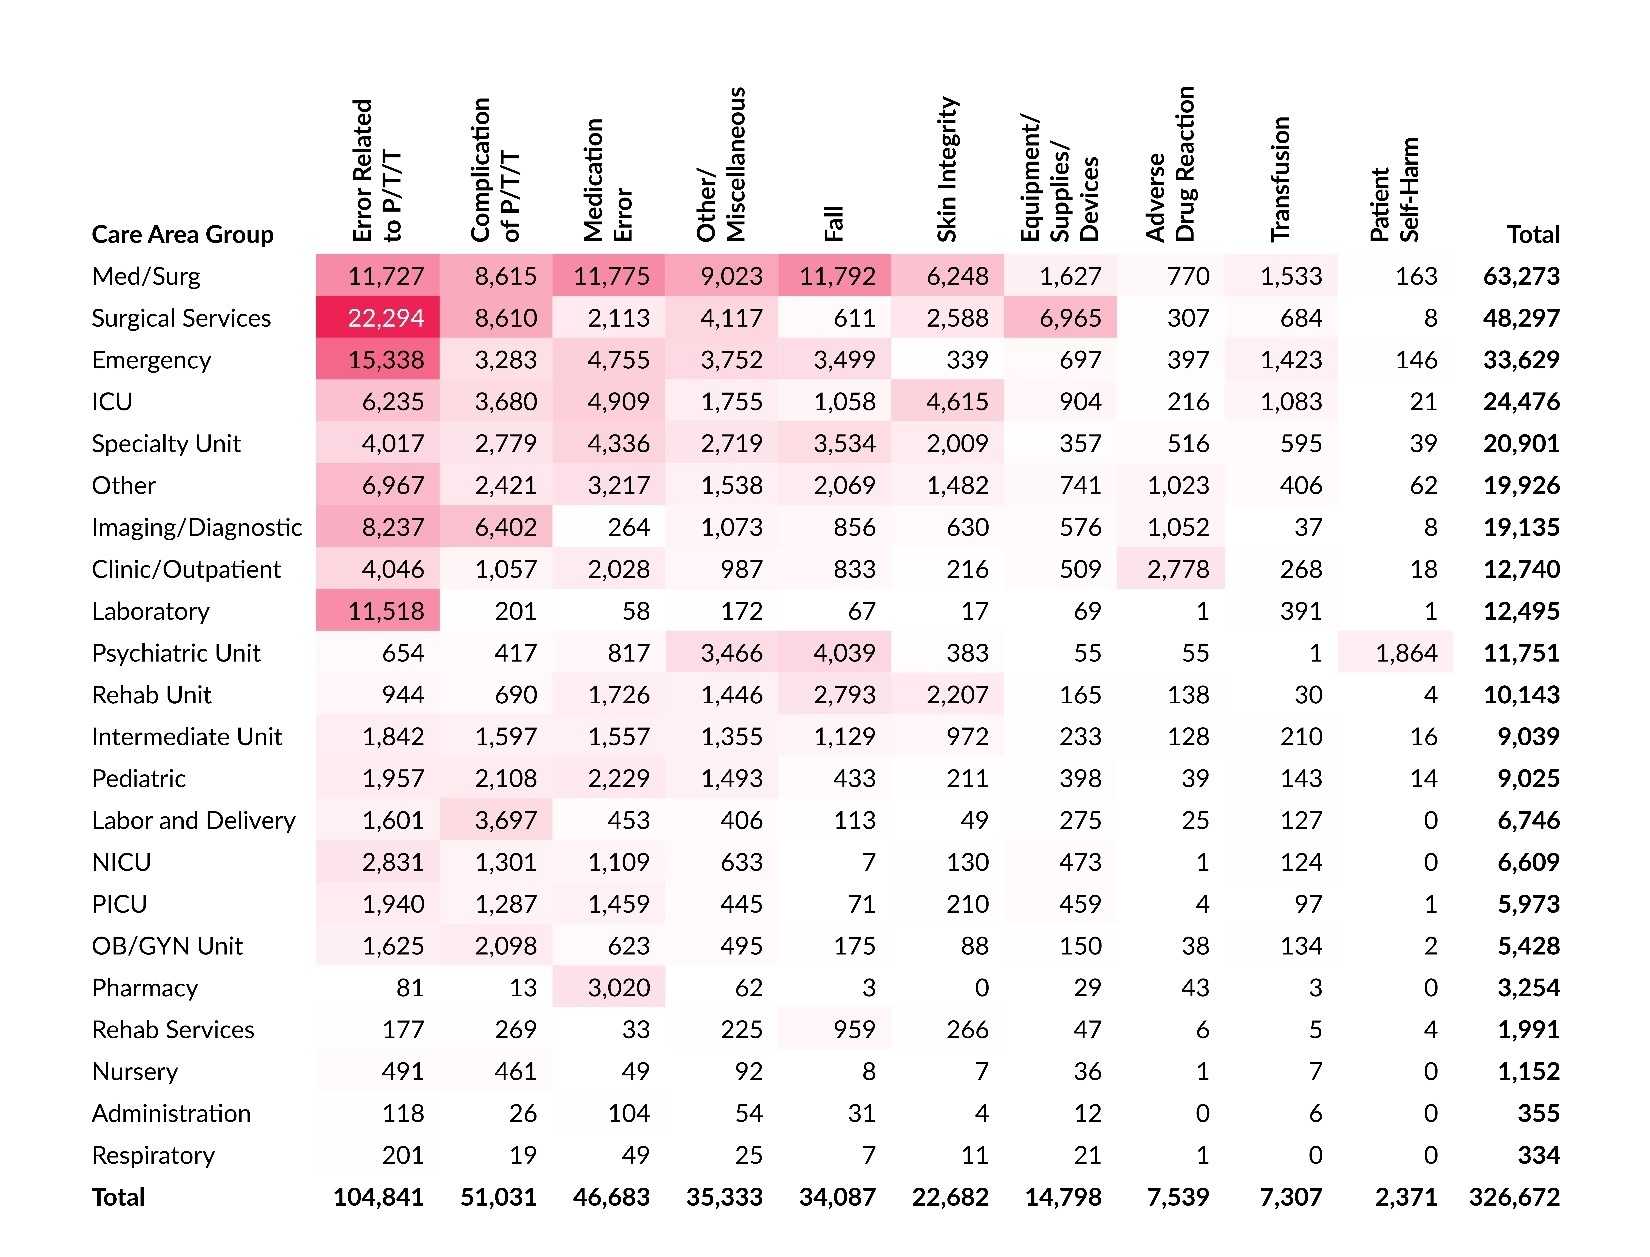
Within PA-PSRS, facilities have 168 options to specify the care area where an event occurred. These care areas are then grouped into broader care area group categories. Table 8 shows a cross tabulation of care area group with harm score. This reflects the same two areas of highest concentration that were seen in the data from the prior two years—cross sections of the Med/Surg care area group and harm scores C and D—which together account for 16.0% of all reports in 2025.

Care Area and Event Type
Table 9 shows a cross tabulation of care area group and event type. The highest concentration of reports is at the intersection of Surgical Services with Error Related to P/T/T, and the second highest concentration is at the intersection of Emergency and Error Related to P/T/T. Together, these account for 11.5% of all reports submitted in 2025. The Med/Surg care area group has the third, fourth, and fifth highest concentrations of reports at the intersections with Fall, Medication Error, and Error Related to P/T/T event types, respectively.
Nonhospital Facilities
Because the overall analysis of reports in the acute care database primarily reflects hospital submissions, it is important to separately analyze data from nonhospital facilities—primarily ASFs, as well as BRCs and ABFs—to identify patient safety issues specific to those settings. Table 10 presents the distribution of reports submitted by these facilities across the 10 main event types from 2021 to 2025. Compared to all facilities combined (Table 4), reports from nonhospital facilities show a distinct distribution. While Error Related to P/T/T remains the most common event type overall, it accounts for a larger share of reports from nonhospital facilities (43.6%) than from all facilities combined (32.1%), even though the share dropped from 47.6% in 2024.
Table 11 displays the distribution of serious event reports submitted by nonhospital facilities from 2021 to 2025. These reports also show a different distribution compared to all facilities (Table 5). While Complication of P/T/T remains the most common serious event type overall, it represents a larger proportion of serious event reports from nonhospital facilities (72.5%) compared to all facilities combined (55.4%).
Discussion
The number of reports submitted to PA-PSRS has varied over the past five years. In 2025, overall submissions exceeded 300,000 for the second consecutive year, while reporting rates decreased slightly for hospitals and ASFs. Several event subtypes exhibited shifts during this period, driven by various factors. Some changes were primarily attributable to reporting shifts at a single facility, others were driven by reporting changes across multiple facilities, and some were associated with variability in the reported data. Collectively, these patterns highlight the importance of considering facility-level context and the potential for subjectivity, variability, or other data quality limitations when interpreting year-to-year changes in statewide patient safety event reporting.
Conclusion
In 2025, the total number of reports and serious event reports submitted to PA-PSRS increased, while the number of high harm reports decreased. The Patient Safety Authority will continue working with Pennsylvania healthcare facilities to enhance reporting quality and promote patient safety.
Notes
This analysis was exempted from review by the Advarra Institutional Review Board.
Data used in this study cannot be made public due to their confidential nature, as outlined in the Medical Care Availability and Reduction of Error (MCARE) Act (Pennsylvania Act 13 of 2002).
Artificial intelligence (Microsoft Copilot) was used only to improve sentence clarity. No AI was used for data analysis, interpretation, or generation of original content. The authors take full responsibility for the accuracy and integrity of the manuscript.
Disclosure
The authors declare that they have no relevant or material financial interests.
About the Authors
Shawn Kepner (shawkepner@pa.gov) is a data scientist at the Patient Safety Authority (PSA). He is responsible for providing actionable insights using data science techniques and works with staff to focus resources and research in areas that have the greatest benefit to patient safety. He also serves as the data editor for Patient Safety, PSA’s award-winning, peer-reviewed journal.
Rebecca Jones, director of Data Science & Research for the Patient Safety Authority, leads a multidisciplinary team advancing patient safety through research that informs improvements in healthcare systems and delivers insights that bridge the gap between evidence and real-world practice. A registered nurse with a Master of Business Administration in healthcare management and certifications in patient safety, human factors, and risk management, she brings clinical experience, analytical expertise, and systems thinking to complex challenges. She has authored more than 40 peer-reviewed publications and contributed to national patient safety efforts with organizations such as the Institute for Healthcare Improvement, the National Quality Forum, and the Society to Improve Diagnosis in Medicine.
PA-PSRS is a secure, web-based system. Pennsylvania hospitals, ambulatory surgical facilities, abortion facilities, and birthing centers submit reports of patient safety–related incidents and serious events in accordance with mandatory reporting laws outlined in the Medical Care Availability and Reduction of Error (MCARE) Act (Act 13 of 2002). All reports submitted through PA-PSRS are confidential and no information about individual facilities or providers is made public.
The Pennsylvania Health Care Cost Containment Council (PHC4) is an independent state agency responsible for addressing the problem of escalating health costs, ensuring the quality of healthcare, and increasing access to healthcare for all citizens regardless of ability to pay. PHC4 has provided data to this entity in an effort to further PHC4’s mission of educating the public and containing healthcare costs in Pennsylvania. PHC4, its agents, and its staff have made no representation, guarantee, or warranty, express or implied, that the data—financial-, patient-, payor-, and physician-specific information—provided to this entity are error-free, or that the use of the data will avoid differences of opinion or interpretation. This analysis was not prepared by PHC4. This analysis was done by the Patient Safety Authority. PHC4, its agents, and its staff bear no responsibility or liability for the results of the analysis, which are solely the opinion of this entity.
Data for prior years may differ from previously published numbers due to subsequent report deletions or classification changes made by reporting facilities.