


Introduction
The Pennsylvania Patient Safety Reporting System (PA-PSRS)[1] is the largest repository of patient safety data in the United States. In addition to over 4.5 million acute care records, PA-PSRS has collected more than 396,000 long-term care (LTC) healthcare-associated infection (HAI) reports since 2009. In 2022, 20,216 HAIs were reported by 636 of Pennsylvania’s LTC facilities.
Methods
The LTC data from PA-PSRS were extracted on March 1, 2023, to allow additional time for rate calculations based on resident and device utilization days. Reports submitted by LTC facilities and specific care areas were included for infection rates each month if resident and device days were also entered in PA-PSRS for the facility and care area.
Infection counts reflect the year when infection reports were submitted in PA-PSRS. Overall rates are based on infection confirmation dates and resident days. Specific infection rates related to urinary catheters and central lines are based on urinary catheter and central line days, respectively. In addition, rates are expressed as infections per 1,000 resident, catheter, or central line days. Infection rates from prior years may differ from information in previous publications, as facilities may have since submitted or made changes to reports and/or entered utilization data in PA-PSRS.
Results
The number of reports increased by 12.5% from 2021, with 20,216 reported infections in 2022 (see Figure 1). This is the first annual increase in reports since the 1.9% increase in 2018. The number of resident days increased by 1.7% from 2021, with 23.4 million resident days reported in 2022 (see Figure 1). This is the first annual increase in resident days since the 1.5% increase in 2019. Even with this increase in resident days from 2021 to 2022, the number of resident days was 3.8 million below the number in 2019, the year prior to the COVID-19 pandemic.

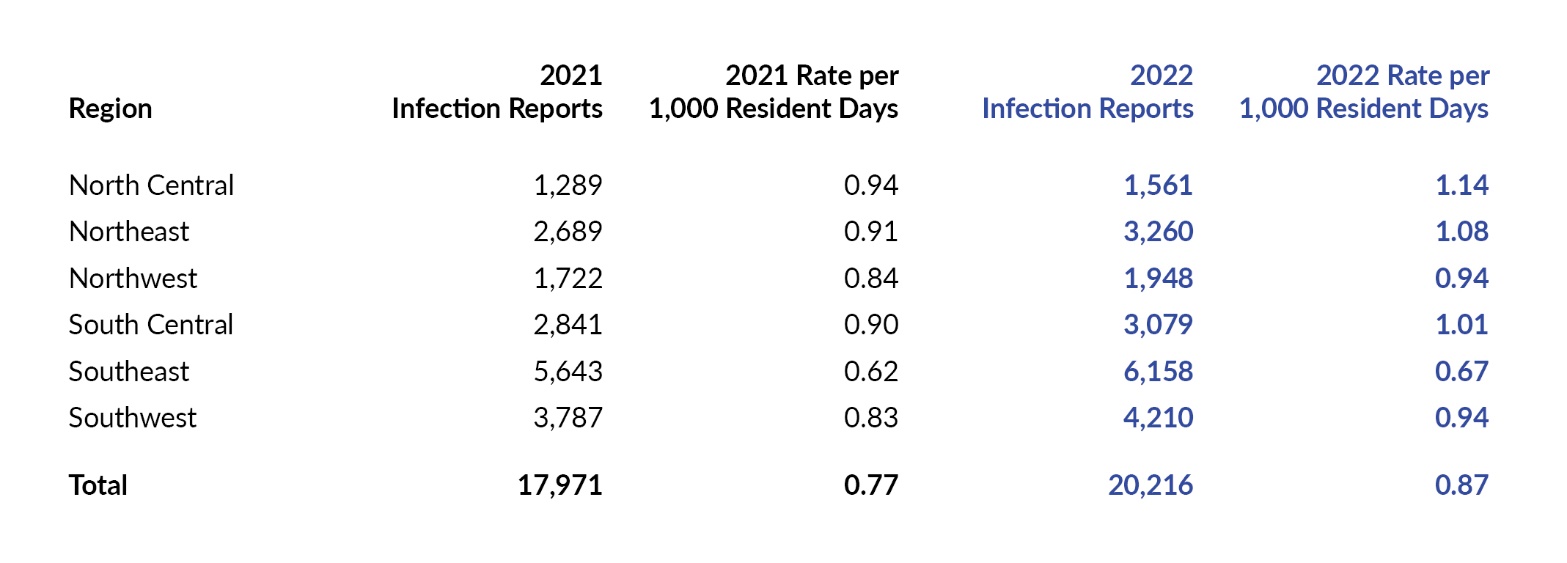
In 2022, the overall infection rate was 0.87 infections per 1,000 resident days, which is a 13.0% increase from the 2021 rate of 0.77. Over half (56%) of the increase in the overall rate is due to an increase in the respiratory tract infection rate, with another 27% due to an increase in the gastrointestinal infection rate. As shown in Figure 2, the North Central region had the highest rate of reported infections in 2022, with 1.14 reports per 1,000 resident days. The Southeast region had the lowest rate, at 0.67. The distribution of LTC infection reports submitted in 2022 by region is shown in Table 1.


LTC Healthcare-Associated Infections
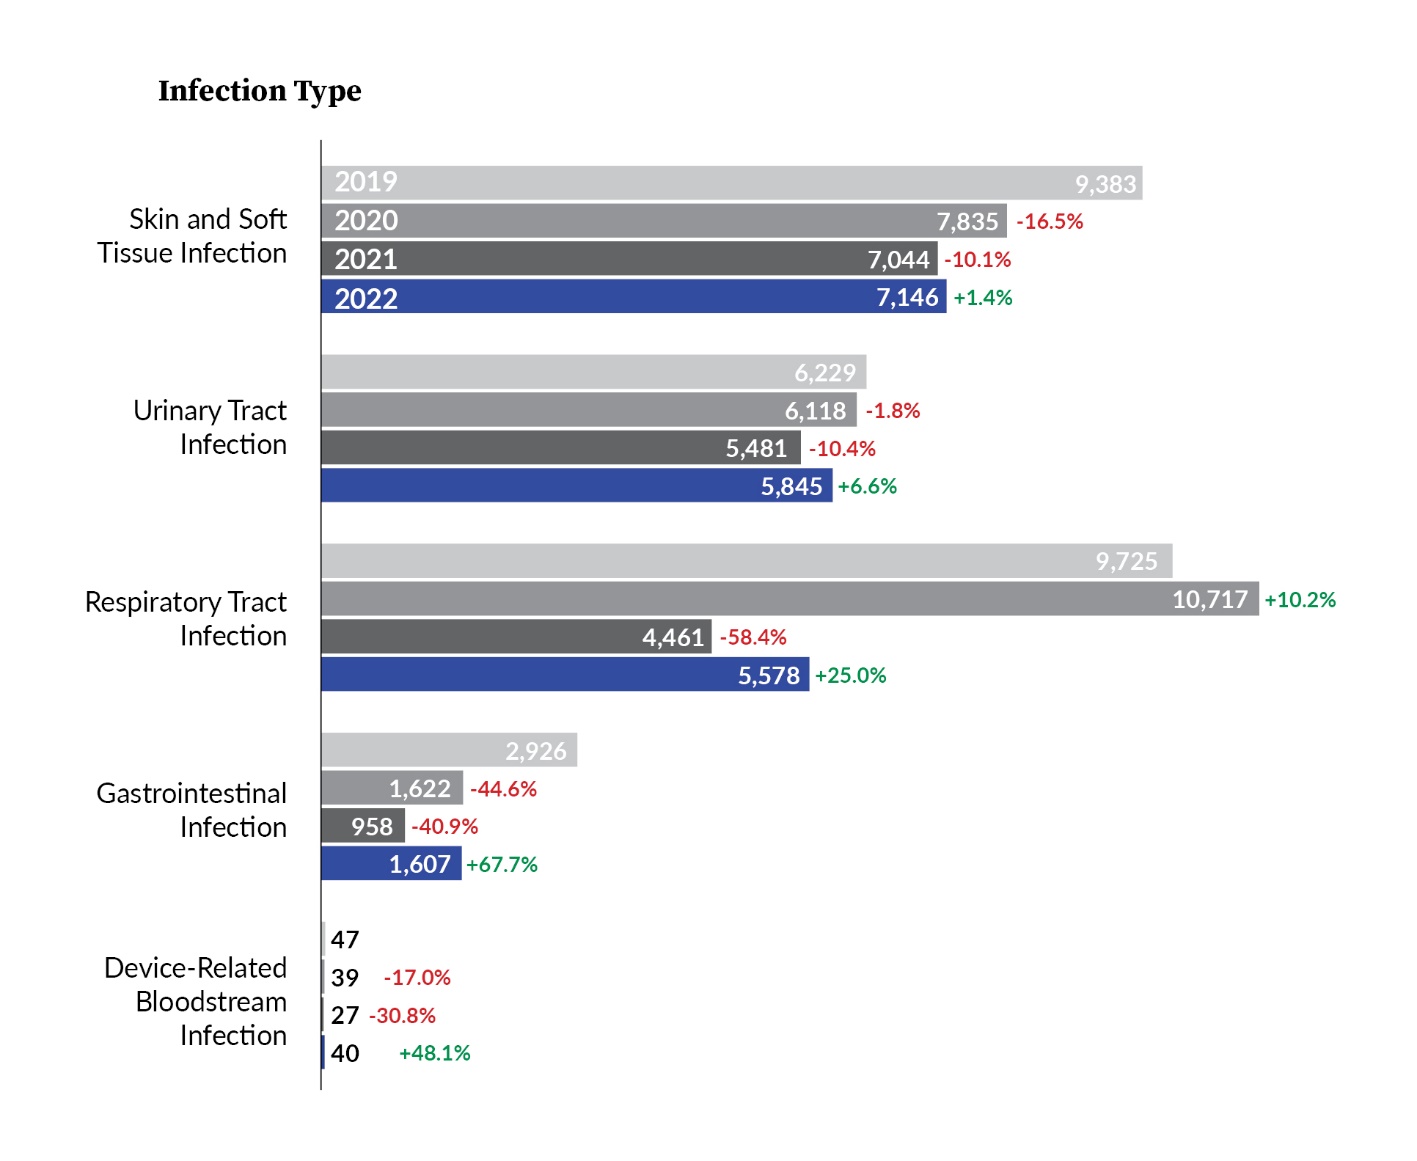
Reports submitted by LTC facilities to PA-PSRS are classified into five main infection types (see Figure 3). In 2019 and 2020, respiratory tract infections were the most frequently reported infection type. In 2021 and 2022, respiratory tract infections were the third most frequently reported, behind skin and soft tissue and urinary tract infections. The number of reports for all infection types increased from 2021 to 2022, with the largest percentage increases occurring with gastrointestinal infection (+67.7%) and device-related bloodstream infection (+48.1%).

LTC Healthcare-Associated Infection Subtypes
Table 2 shows the number of reports for all infection subtypes. The most frequently reported subtype in 2022 was cellulitis, soft tissue, or wound infection, followed by symptomatic urinary tract infection (SUTI) and pneumonia, which is the same top-three subtype ordering as the prior year. Of the 14 infection subtypes, 11 had an increase in number of reports from 2021 to 2022, with influenza showing the largest increase of 857 reports. Norovirus had the largest percentage increase of 942.9%, going from 70 reported infections in 2021 to 730 in 2022. The three subtypes that decreased in number had relatively smaller changes than the increases, with the largest of the decreases occurring with C. diff, which dropped by 29 reports from 2021 to 2022.

Care Area
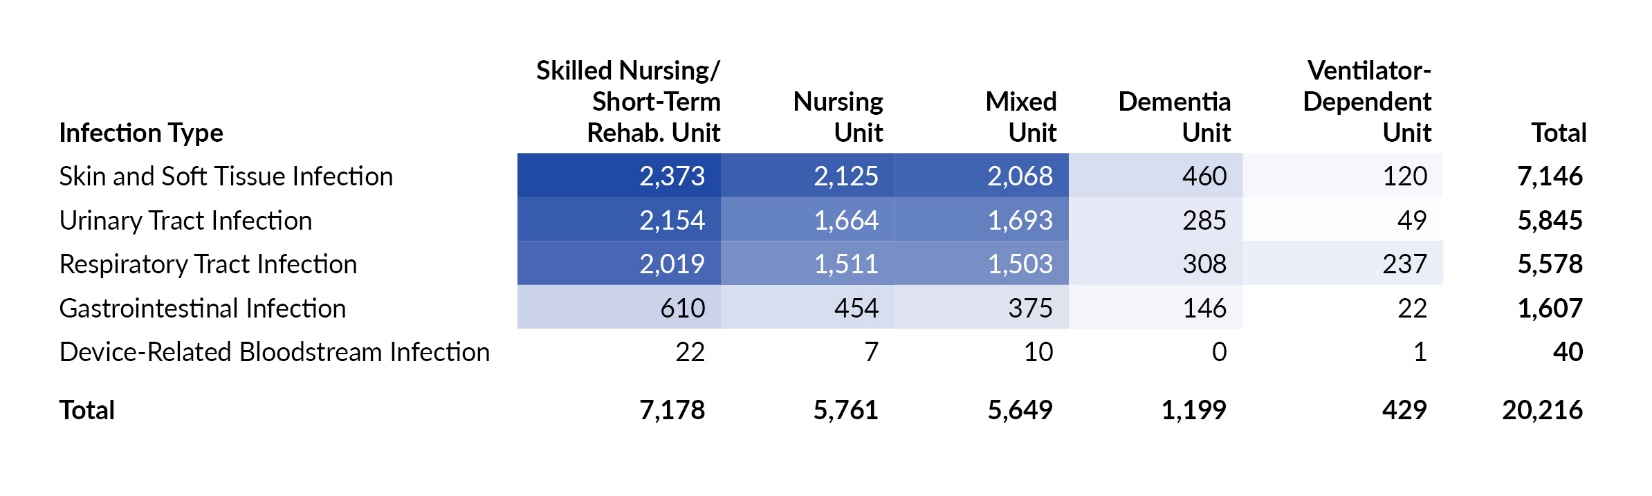
Table 3 shows the distribution of 2022 reports by infection type and care area. Skilled nursing/short-term rehabilitation units accounted for the largest proportion of infections (7,178 of 20,216; 35.5%). In 2022, skin and soft tissue infections were reported more than any other infection type in all care areas except ventilator-dependent units, in which respiratory tract infections were most frequently reported. Table 4 shows the 2022 distribution of infection reports by infection subtype and care area. The largest concentration of reports in 2022 is found with SUTI in skilled nursing/short-term rehabilitation units.


LTC Healthcare-Associated Infection Rates
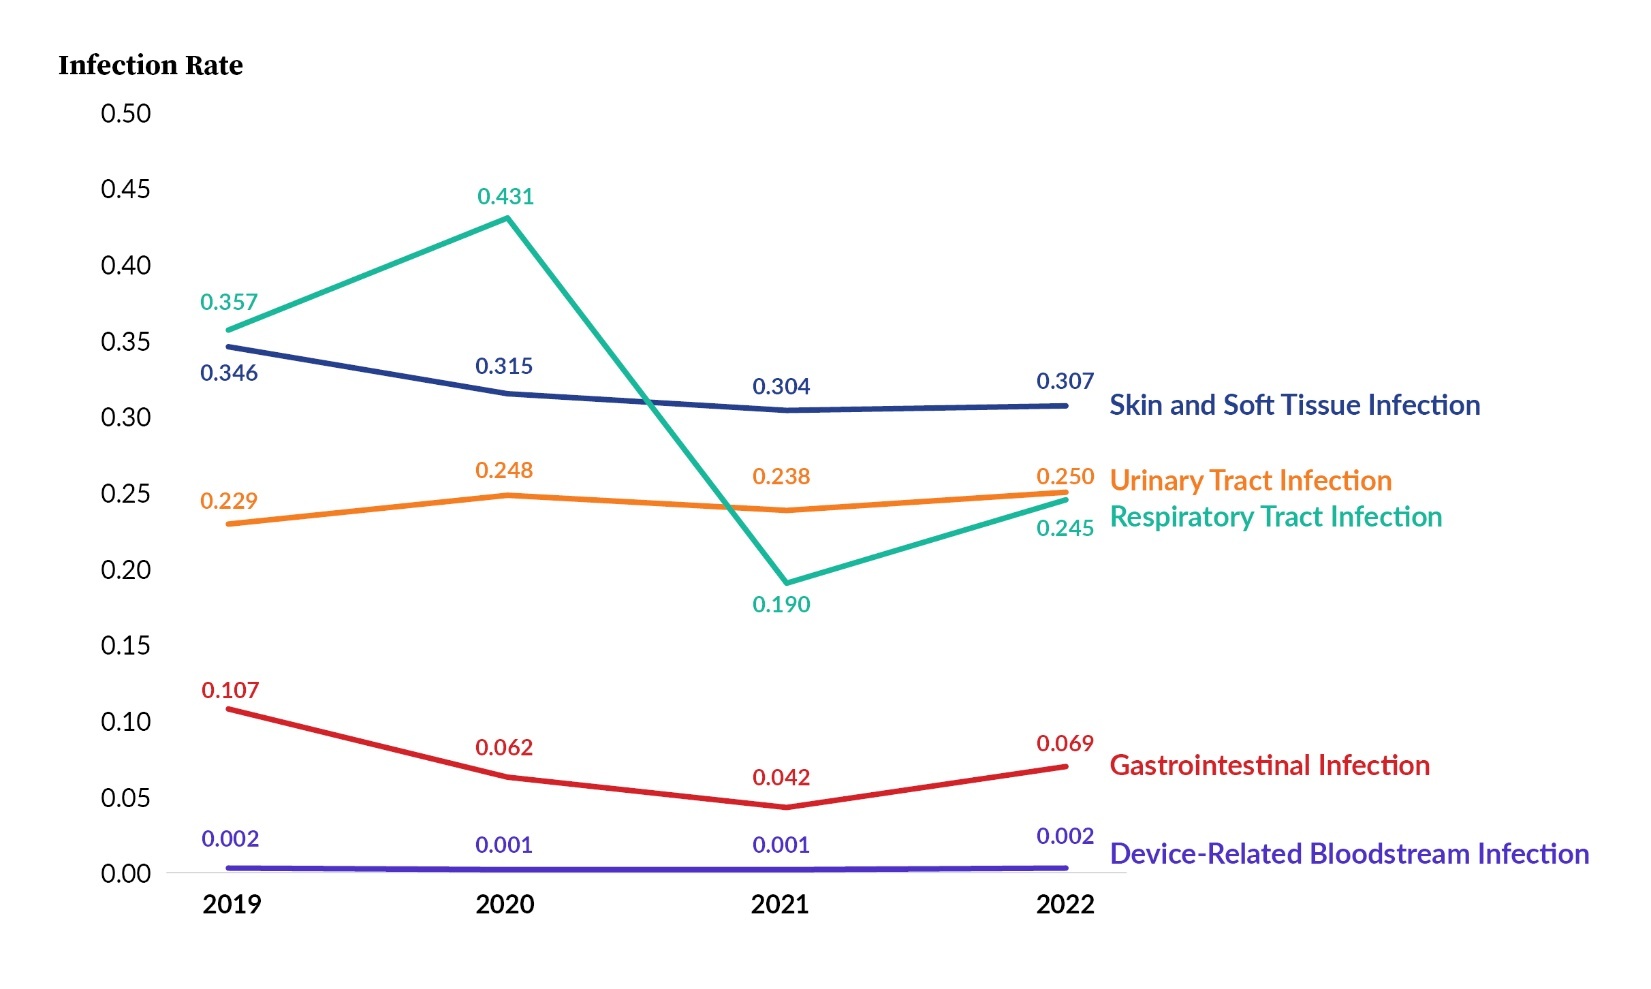
Figure 4 shows infection rates per 1,000 resident days for the five infection types for 2019 through 2022. All rates decreased from 2020 to 2021 and increased from 2021 to 2022.
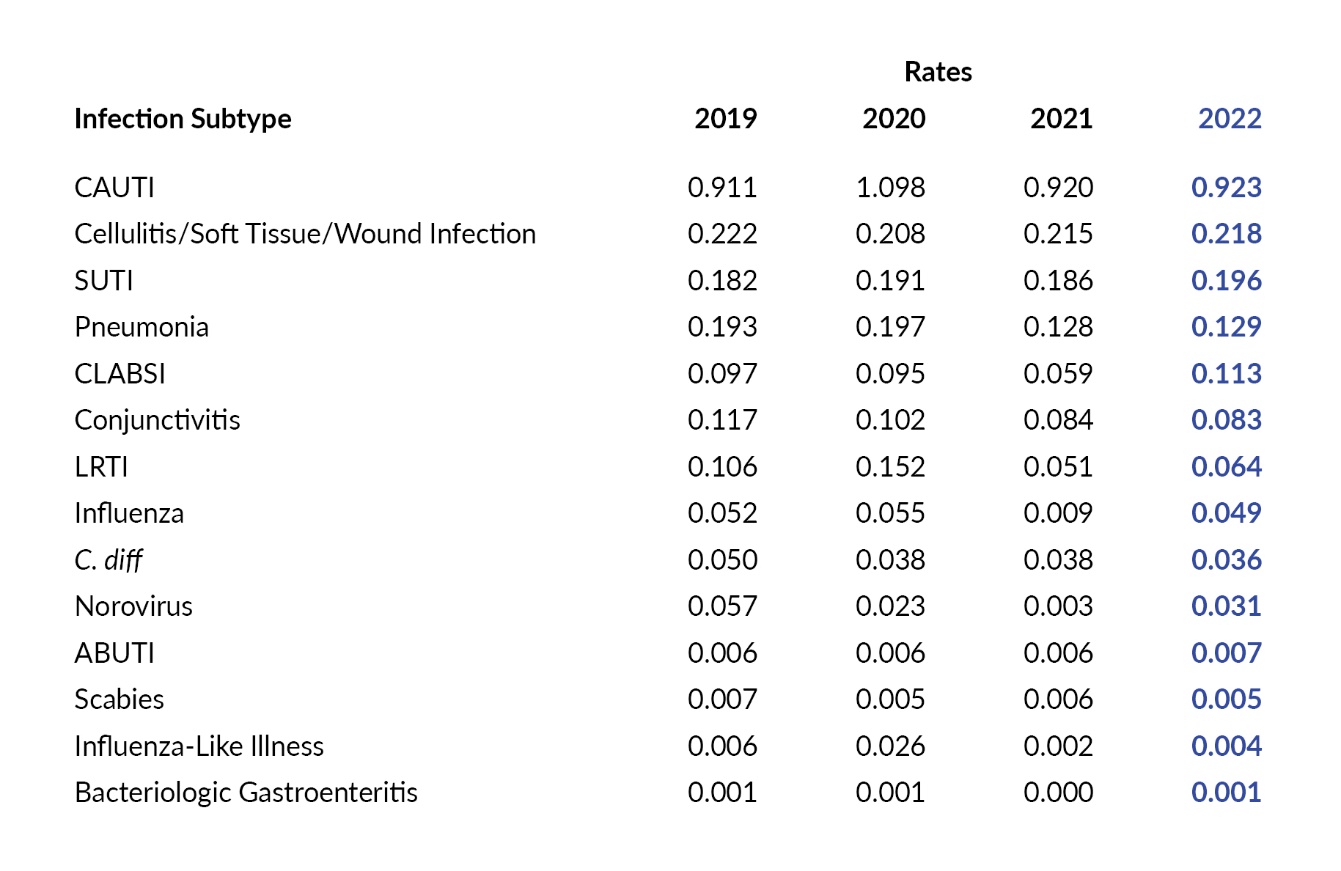
In Figure 5 and Table 5, rates are shown for each infection subtype for 2019 through 2022. Similar to percentage increases in the number of reports, the subtypes with the largest percentage increases in rate from 2021 to 2022 are norovirus (+873.6%) and influenza (+423.8%).


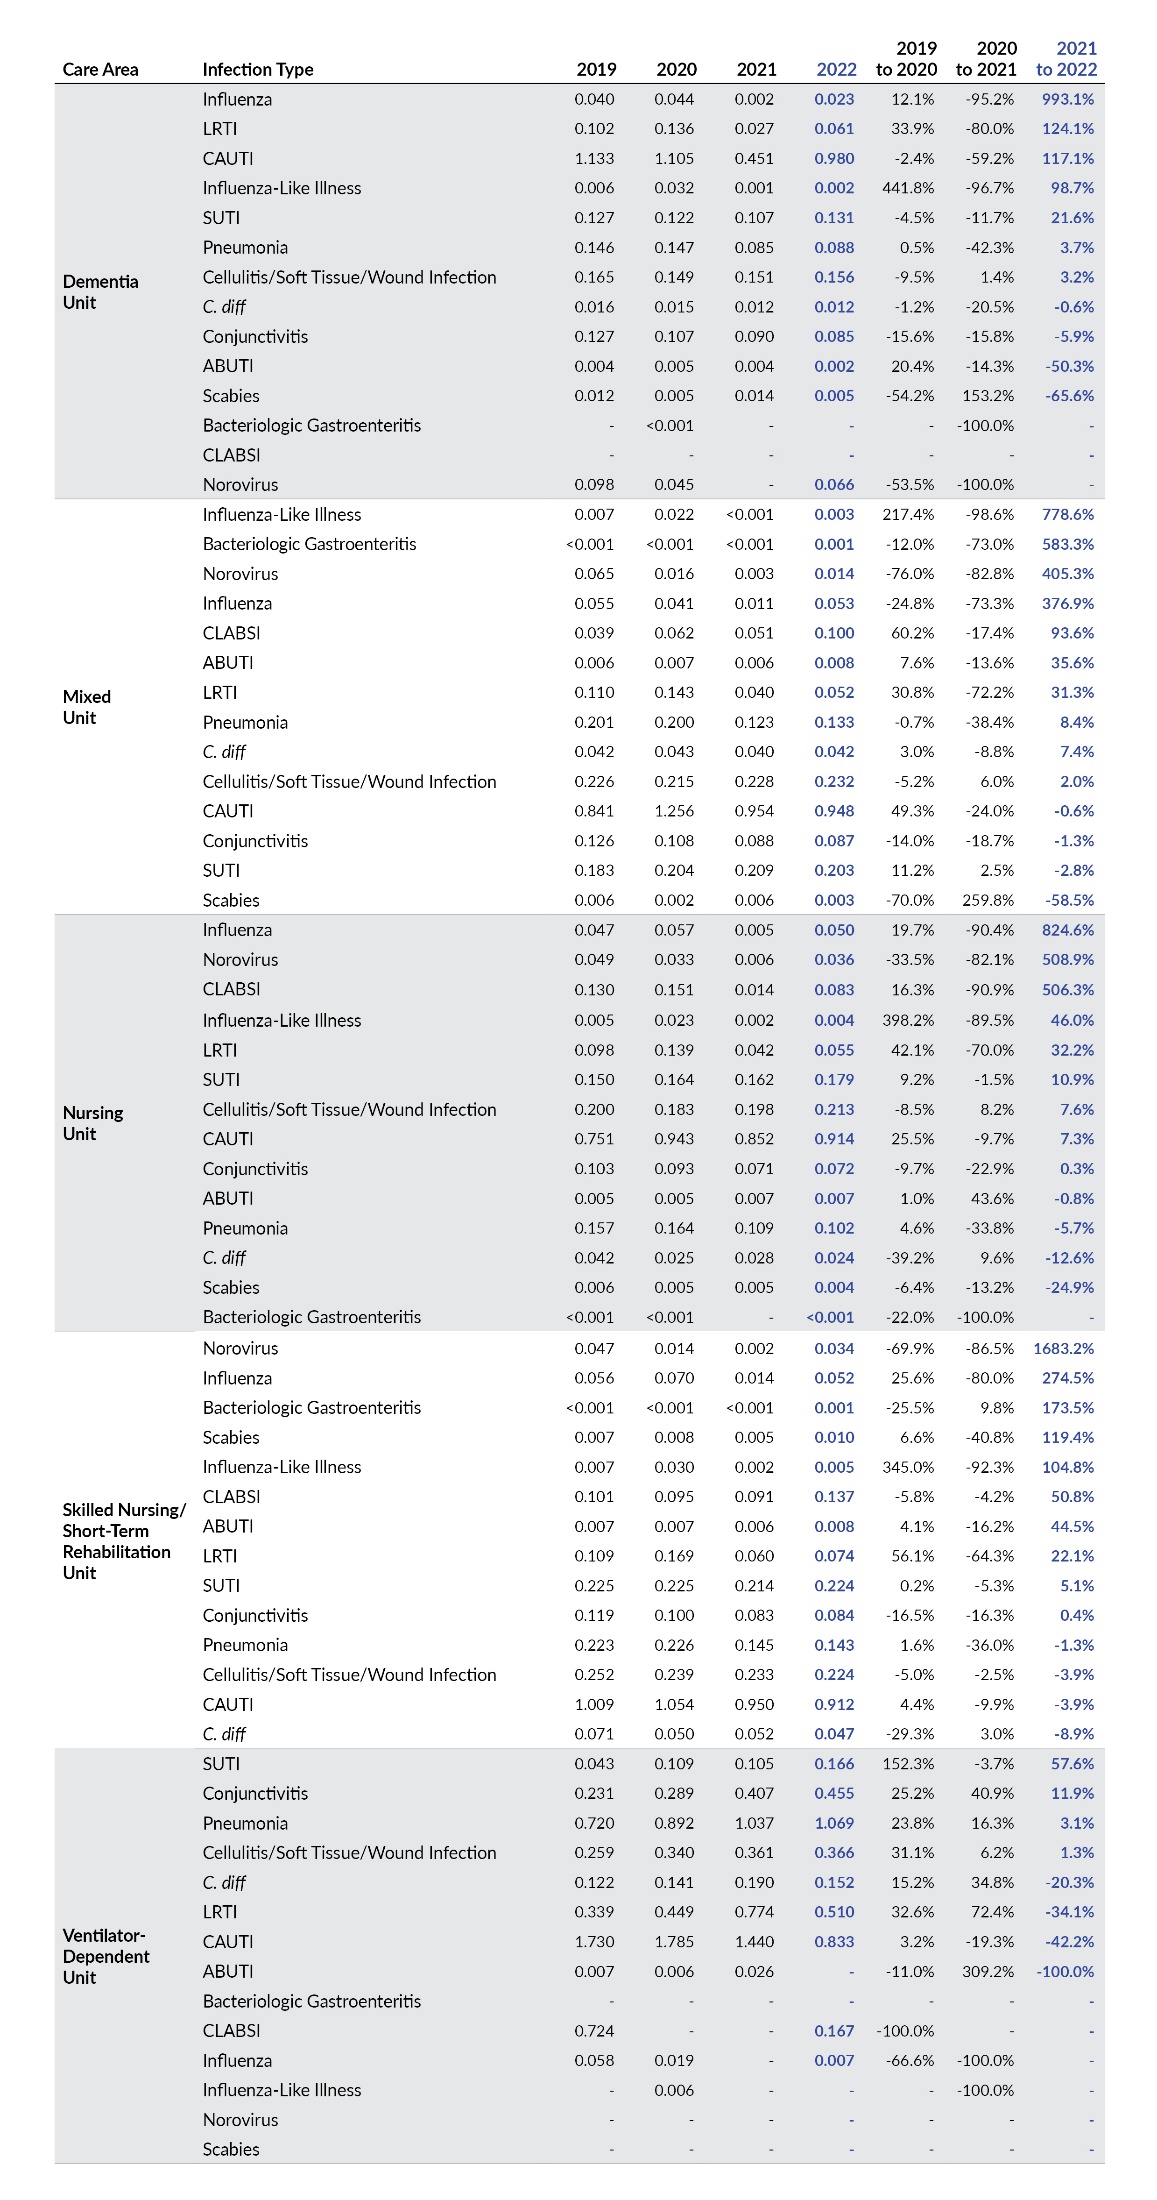
In Table 6, the infection rates are displayed by year based on care area and infection subtype. The largest percentage increases in rate from 2021 to 2022 occurred with norovirus in skilled nursing/short-term rehabilitation units (+1,683.2%), influenza in dementia units (+993.1%), influenza in nursing units (+824.6%), and influenza-like illness in mixed units (+778.6%).

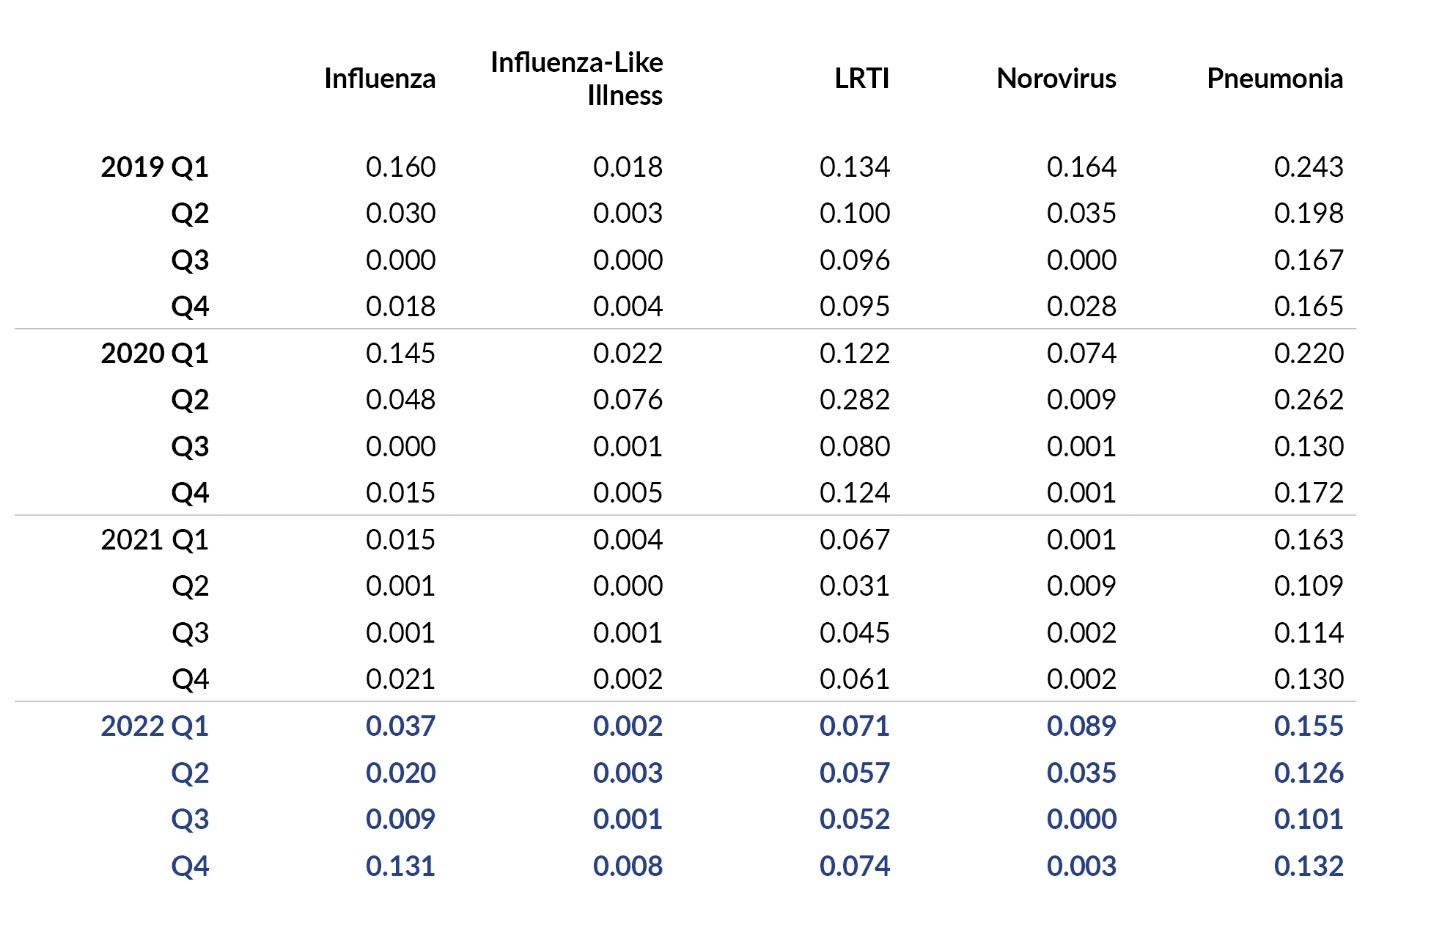
Figure 6 and Table 7 display infection rates for influenza, influenza-like illness, pneumonia, lower respiratory tract infection (LRTI), and norovirus by quarter for 2019 through 2022. These rates are calculated as the number of infections, using the infection confirmation date, by quarter, per 1,000 resident days. As seen in Figure 6, over the past four years, norovirus infections hit a peak rate in Q1 2019 with 0.164 infections per 1,000 resident days. Rates for all four respiratory tract infection subtypes increased from Q3 2022 to Q4 2022: influenza (+1,355.6%), influenza-like illness (+700.0%), LRTI (+42.3%), and pneumonia (+30.7%).

Discussion
Pennsylvania’s LTC facilities reported 20,216 infections and 23.4 million resident days in PA-PSRS in 2022, resulting in a rate of 0.87 infections per 1,000 resident days. This represents a 12.5% increase in the total number of infection reports and a 13.0% increase in the rate of reported infections when compared to 2021. Over half of the increase in overall rate is due to an increase in the rate of reported respiratory tract infections, with another quarter due to an increase in the rate of reported gastrointestinal infections. The number of reports for all five main infection types also increased from 2021 to 2022. The infection subtype with the greatest increase in number of reports in 2022 was influenza, which is consistent with the high prevalence of influenza across the United States during the fourth quarter of 2022.2 In terms of percentage, the largest increase was seen with norovirus. The increases noted with influenza and norovirus may be related to changes in state guidance3 and less-restrictive requirements for personal protective equipment to prevent transmission of COVID-19 in LTC facilities.
The years since COVID-19 have been especially hard on LTC facilities as emergency priority changes and staffing issues have impacted operations. Through outreach activities, the Patient Safety Authority’s (PSA) infection preventionists (IPs) continue to note high turnover and the assignment of additional responsibilities to LTC IPs, which has likely impacted reporting. For example, some LTC IPs have erroneously presumed that reports of COVID-19 suspected or confirmed infections reported to the Centers for Medicare & Medicaid Services (CMS) through the National Healthcare Safety Network (NHSN) fully met all reporting requirements for these events. As a result, it is likely that some influenza-like illnesses and LRTIs have gone unreported to PA-PSRS. PSA IPs continue to work with LTC facilities to provide guidance and education, including purposeful outreach to LTC facilities that have reported a low volume of infections or incomplete information in PA-PSRS, formal and informal education, access to toolkits and surveillance materials, one-on-one training, and collaborative activities with facility administrative teams.
Conclusion
In 2022, there was an increase in the total number and rate of infections reported to PA-PSRS by Pennsylvania’s LTC facilities. There were also increases in the number of reports submitted for all five main infection types. Reports of respiratory tract infections and gastrointestinal infections accounted for more than three-quarters of the rate increase, with influenza and norovirus infection subtypes showing the most significant increases in number and percentage of reports between 2021 and 2022. PSA IPs continue to note operational challenges in LTC facilities and are providing ongoing education and guidance to enhance infection prevention and surveillance strategies and improve reporting of HAIs.
Note
This analysis was exempted from review by the Advarra Institutional Review Board.
Disclosure
The authors declare that they have no relevant or material financial interests.
About the Authors
Shawn Kepner (shawkepner@pa.gov) is a data scientist at the Patient Safety Authority.
Christine Bingman is a registered nurse and an infection preventionist for the Patient Safety Authority.
Rebecca Jones is director of Data Science and Research at the Patient Safety Authority (PSA) and founder and director of the PSA’s Center of Excellence for Improving Diagnosis.
PA-PSRS is a secure, web-based system through which Pennsylvania long-term care facilities submit reports of healthcare-associated infections in accordance with mandatory reporting laws outlined in the Medical Care Availability and Reduction of Error (MCARE) Act (Act 52 of 2007).1 All reports submitted through PA-PSRS are confidential and no information about individual facilities or providers is made public.