


Introduction
Pennsylvania is the only state that requires healthcare facilities to report all events that cause harm or have the potential to cause harm to a patient. These patient safety events are reported to the Pennsylvania Patient Safety Reporting System (PA-PSRS)[1], which is the largest repository of patient safety data in the United States and one of the largest in the world, with over 4.5 million acute care records.
This article provides details from the PA-PSRS acute care reports submitted in 2022, along with data and insights that can be used to focus improvements in patient safety.
Definitions
Terms describing patient safety occurrences, including “serious event,” “medical error,” “adverse event,” “harm,” and “incident,” are often used interchangeably. However, within the context of this manuscript they have distinct meanings and indications for whether they must be reported to PA-PSRS in accordance with the Medical Care Availability and Reduction of Error (MCARE) Act (Act 13 of 2002).1 An “incident” is defined as “an event, occurrence, or situation involving the clinical care of a patient in a medical facility which could have injured the patient but did not either cause an unanticipated injury or require the delivery of additional healthcare services to the patient.”1 A “serious event” is defined as “an event, occurrence, or situation involving the clinical care of a patient in a medical facility that results in death or compromises patient safety and results in an unanticipated injury requiring the delivery of additional healthcare services to the patient.”1
Each event report includes a harm score—assigned by the reporting facility—that describes the potential or actual harm to the patient resulting from the event. Table 1 lists the definition for each harm score, along with harm score groupings for incidents, serious events, and high harm events.

Methods
This analysis was performed using data extracted from PA-PSRS on February 1, 2023, and data from the Pennsylvania Health Care Cost Containment Council (PHC4)[2]. Counts of reports are based on report submission date; rates are based on the event occurrence date and calculated per 1,000 patient days for hospitals and per 1,000 surgical encounters for ASFs. Event occurrence date is used for rate calculations to be in line with the same timeframe in which the patient days or surgical encounters occurred. The most current data from PHC4 was for Q2 2022, which allowed us to calculate 2022 rates using the first two quarters of data.
Results
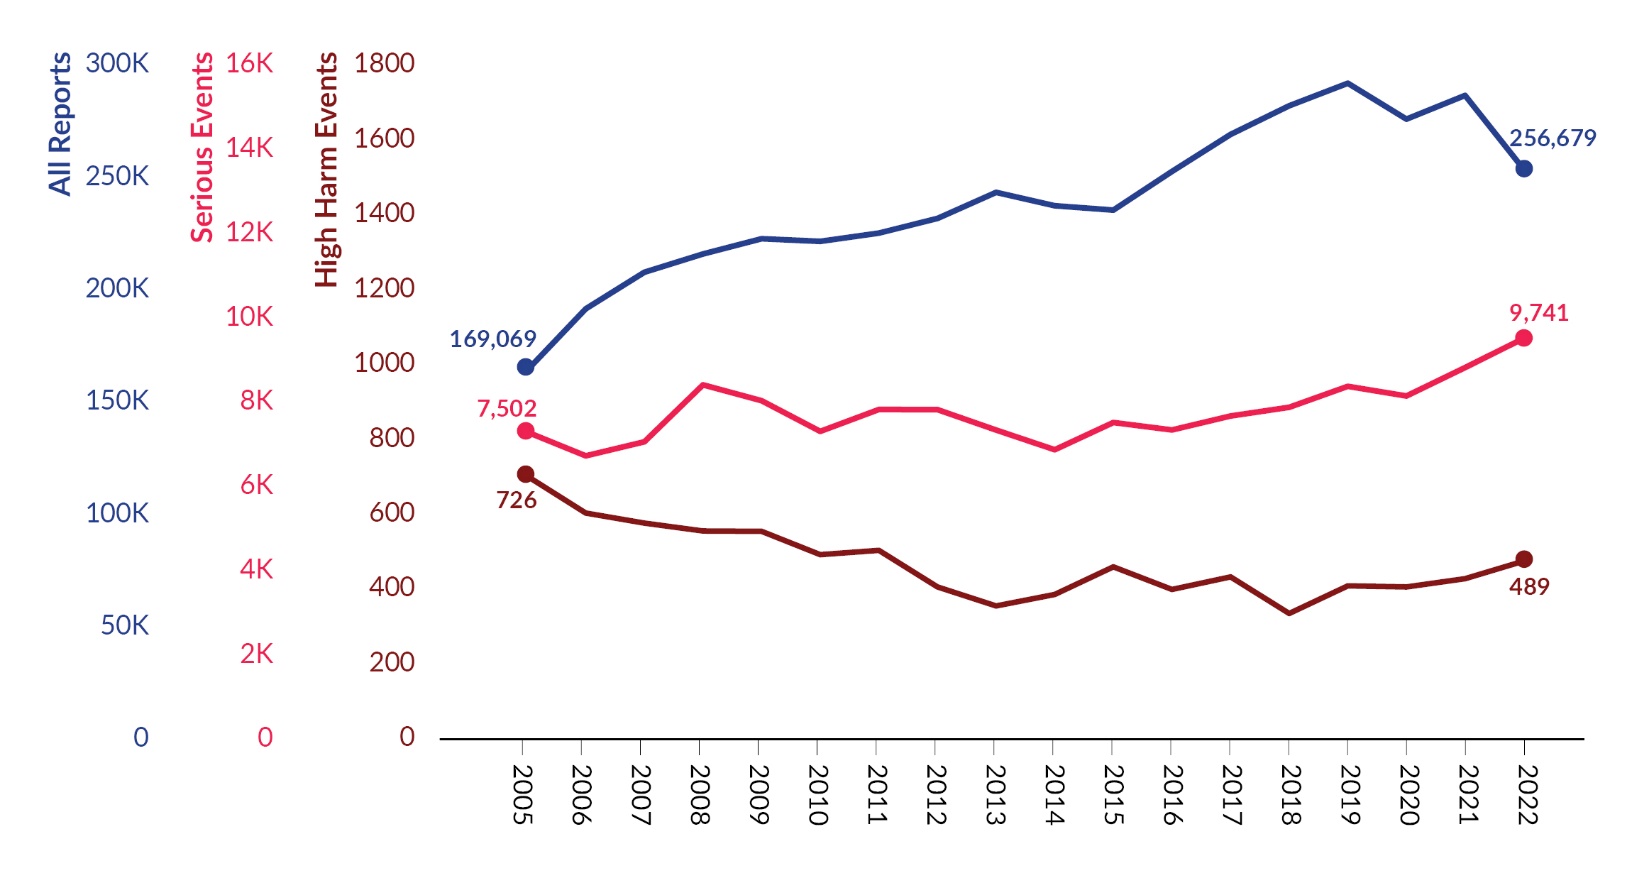
A total of 256,679 reports were submitted by Pennsylvania acute care facilities in 2022, of which 9,741 were serious events. Of those serious events, 489 were classified as high harm (see Figure 1). Serious and high harm events increased by 7.7% and 11.1%, respectively, between 2021 and 2022.

The total number of reports decreased 11.1% in 2022 compared to 2021, which represents the largest year-over-year decrease since the inception of PA-PSRS. Further analysis reflects that three facilities collectively submitted 18,601 fewer reports in 2022 compared to 2021, which accounted for 57.8% of the overall decrease.
Incidents and serious events expressed as a percent of reports are shown in Figure 2. The percentage of reports that were serious events in 2022 represents the largest year-over-year increase, going from 3.1% in 2021 to 3.8% in 2022. While there was an increase in the number of serious event reports submitted in 2022, the increase in percentage of serious events was due, in part, to a significant decrease in the number of incidents submitted.
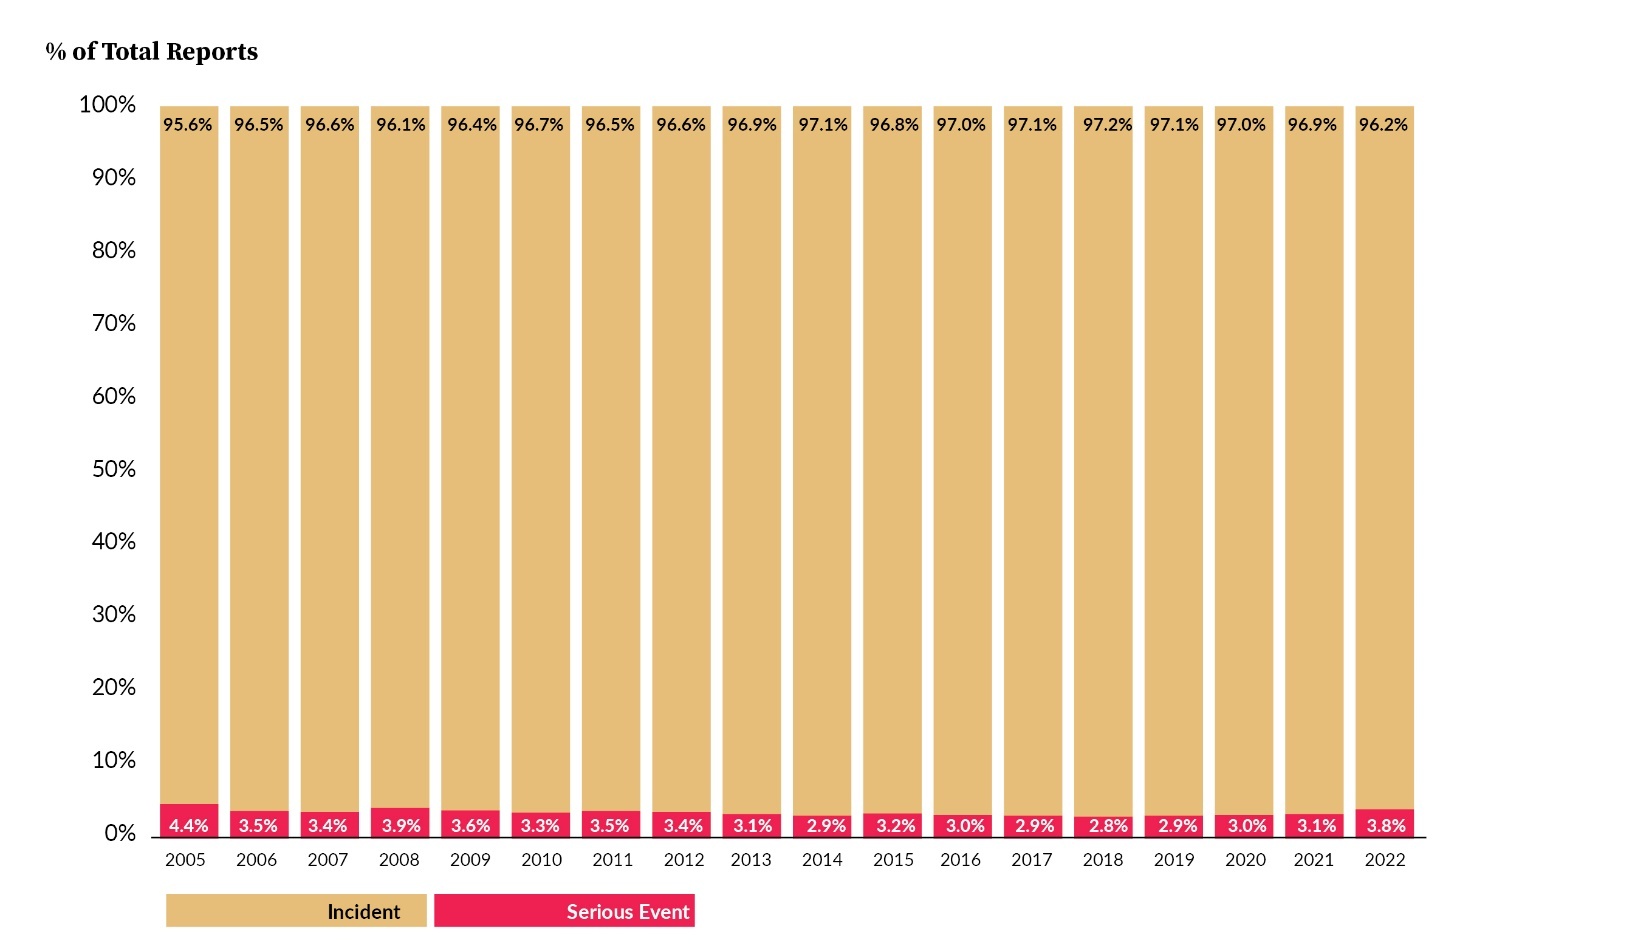
Table 2 shows a breakdown of incidents and serious events by facility type from the past three years. From 2021 to 2022, the number of hospital reports decreased by 33,432 (12.0%), whereas reports from other acute care facilities (ASFs, birthing centers [BRCs], and abortion facilities [ABFs]) increased by 1,253 (13.5%). The percentage of reports submitted by acute care facilities other than hospitals increased for the second straight year, going from 2.8% in 2020 to 3.2% in 2021 and to 4.1% in 2022. The 4.1% in 2022 was comprised of 3.9% from ASFs and 0.2% from BRCs and ABFs. The increase in 2022 is a result of the increase in reports submitted by other acute care facilities and the decrease in reports submitted by hospitals.

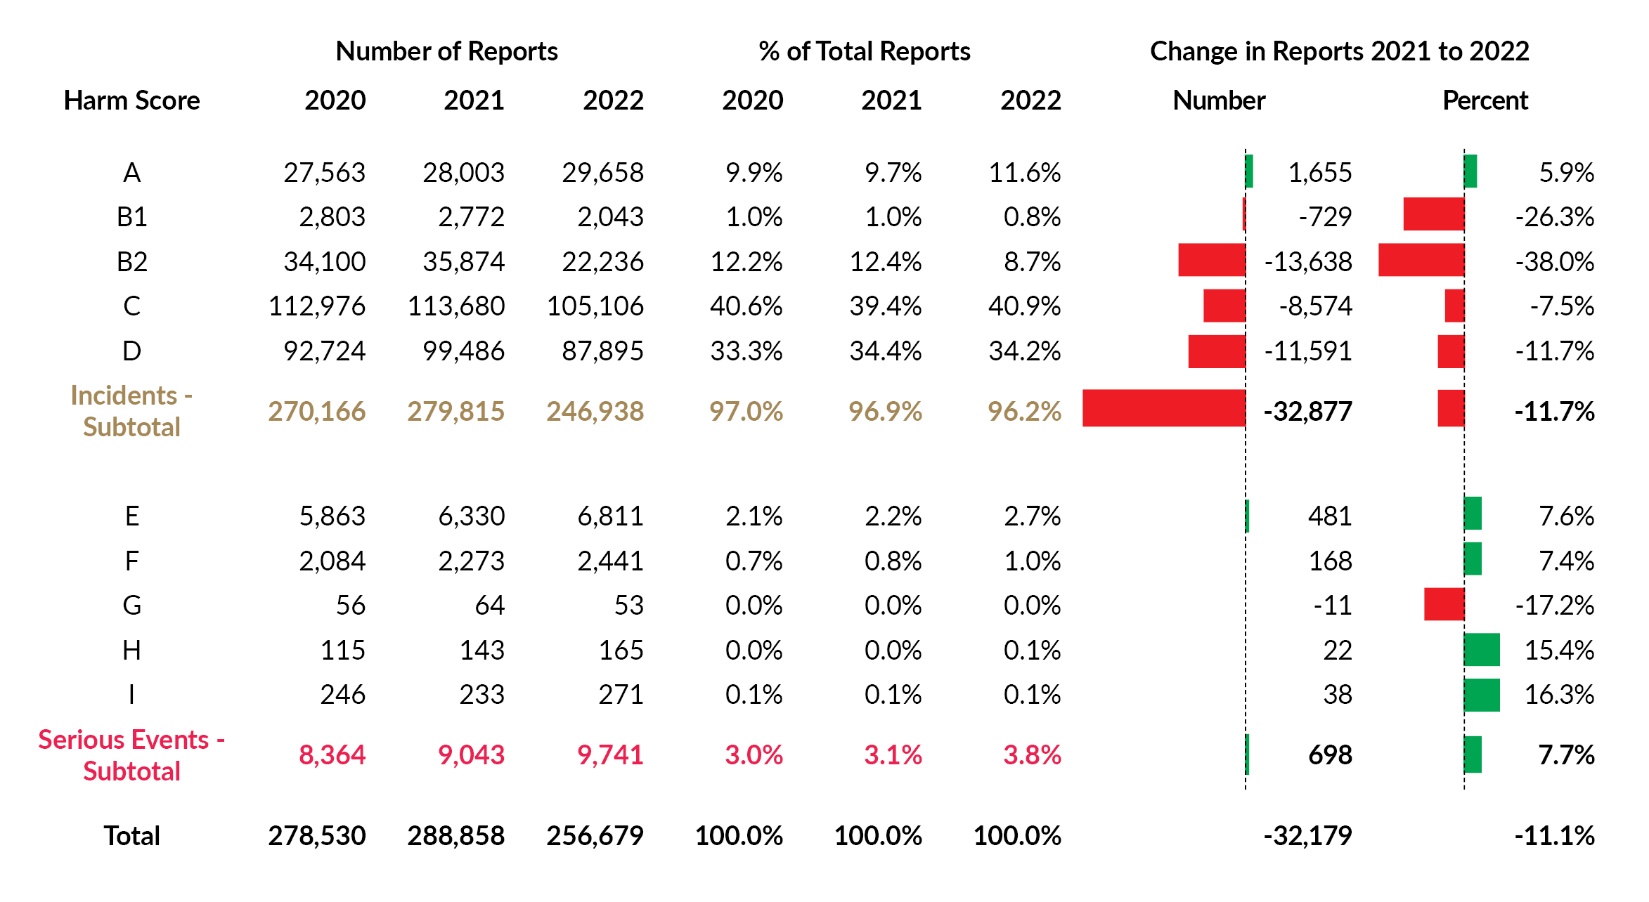
The harm score distribution for reports submitted during years 2020–2022 is shown in Table 3. Consistently, the most frequent harm score is C (40.9% in 2022), followed by harm scores D, A, and B2. Harm scores B2, C, and D showed the largest decreases in number of reports submitted. Serious events comprised 3.8% of all reports in 2022, with harm scores E and F being reported most frequently.

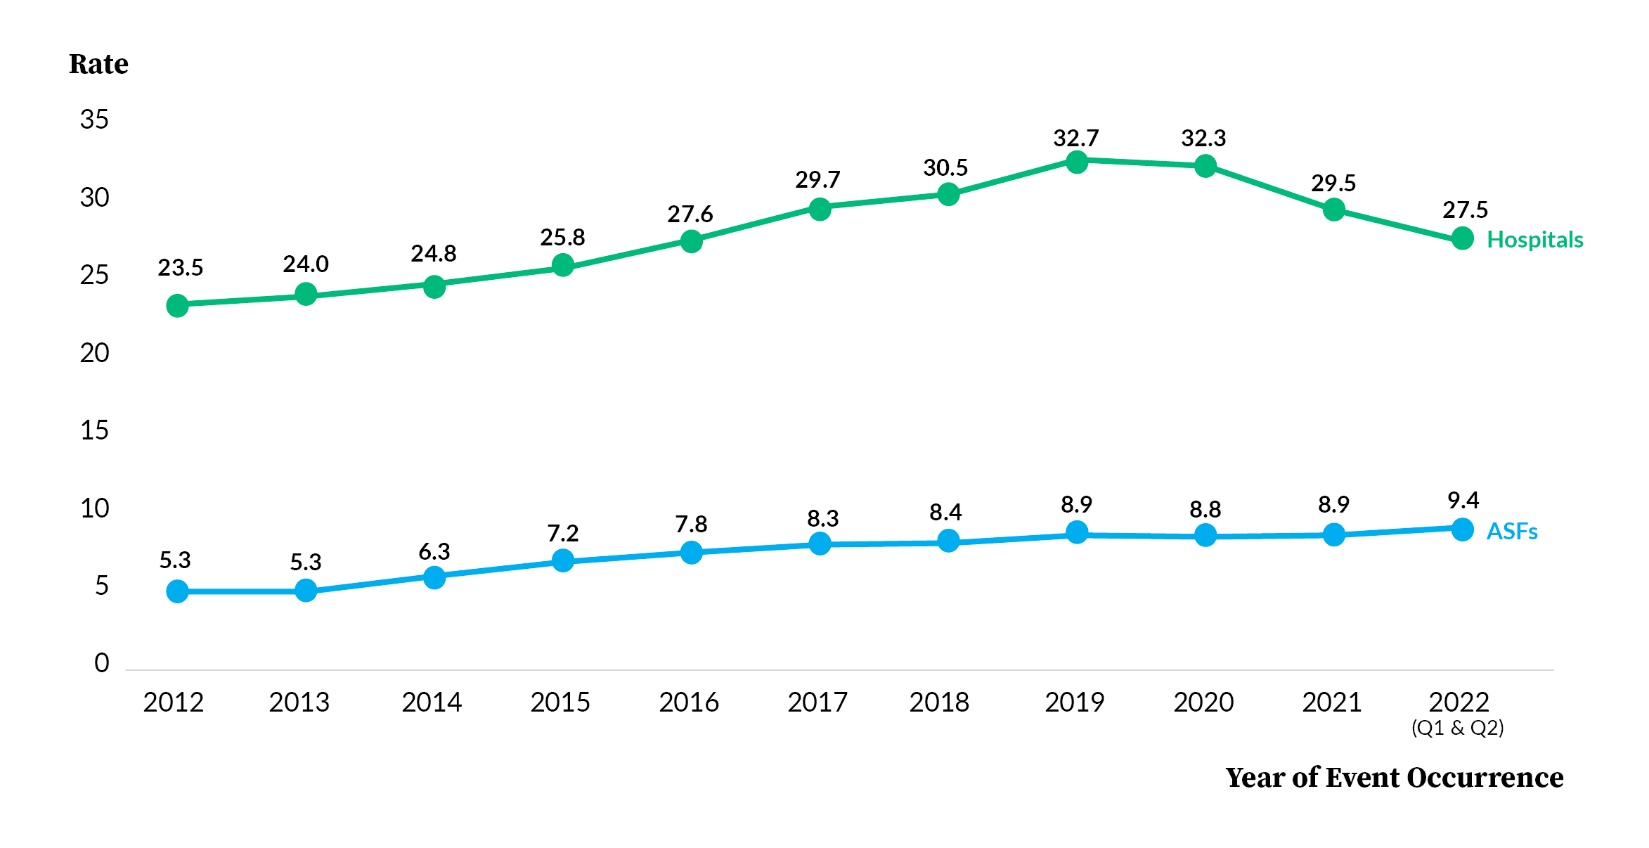
Rates are standardized statistics used for direct, per-unit comparisons over time. In this analysis, rates are based on the event occurrence date and calculated per 1,000 patient days for hospitals and per 1,000 surgical encounters for ASFs. Figure 3 shows that the 2022 reported event rate for hospitals for reports with event occurrence dates through Q2 2022 decreased by 2.0 percentage points from 2021, bringing the reported event rate for the first half of calendar year 2022 to 27.5, the lowest level it has been since 2016 when it was 27.6; for ASFs, the 2022 reported event rate through Q2 2022 is higher than the rate in 2021 (9.4 and 8.9, respectively).

Event Types
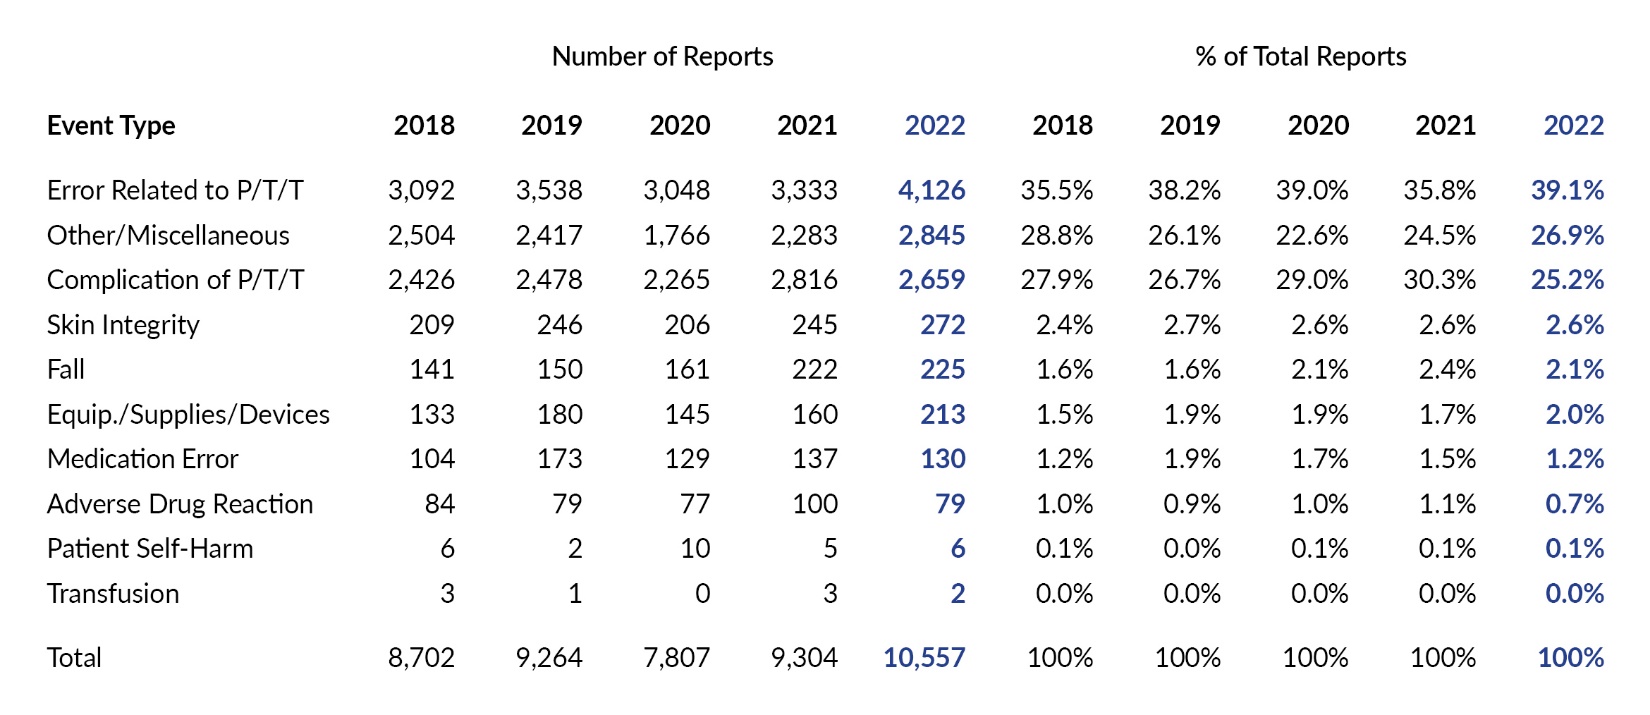
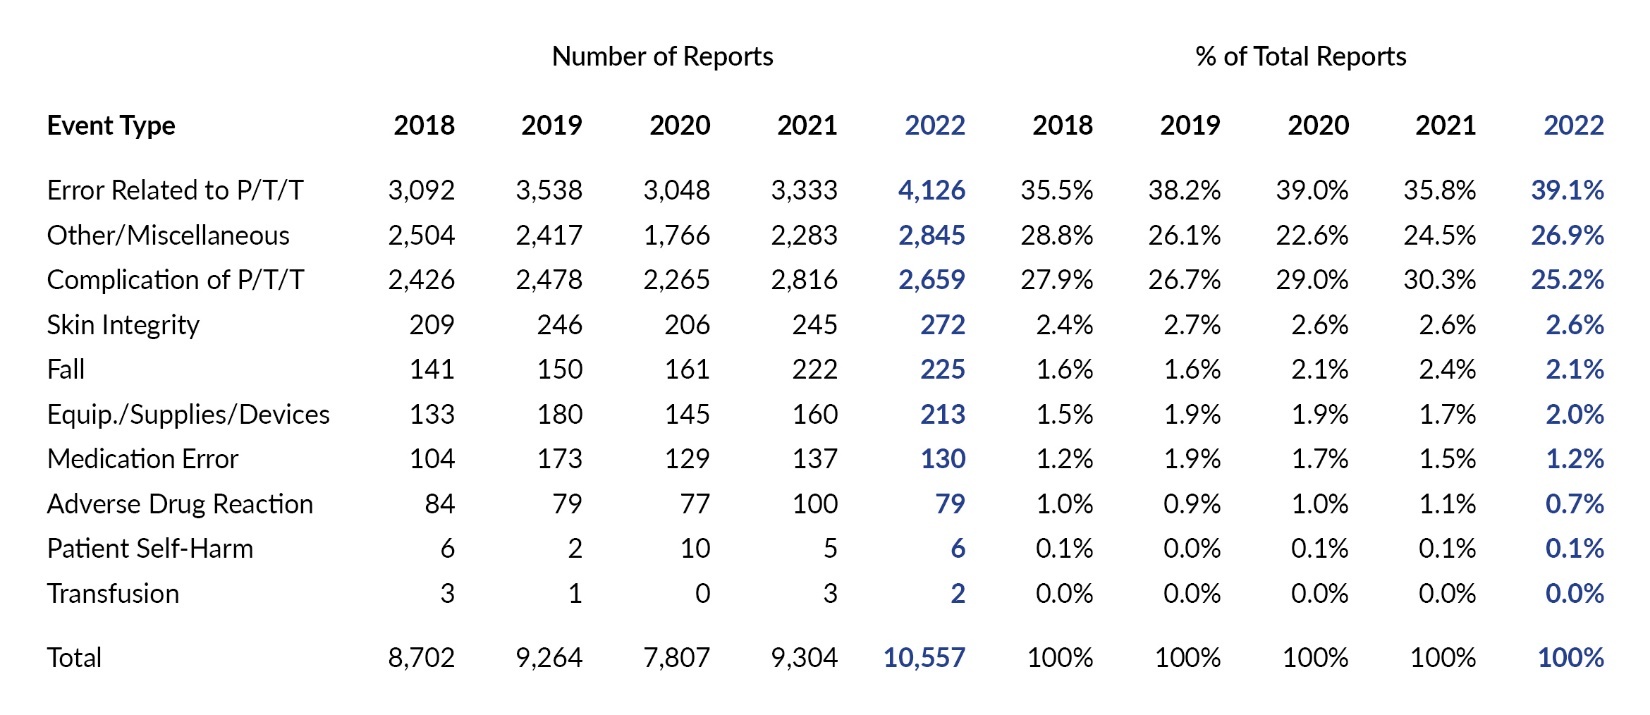
Each PA-PSRS report includes an event type and subtype(s) that are assigned by the reporting facility. The reporting taxonomy for incidents and serious events provides for 10 main event types, with 228 possible combinations of event type and subtype(s). Table 4 shows the number of reports for each main event type over the past five years. For each of the past five years, the most frequently reported event type is Error Related to Procedure/Treatment/Test (P/T/T) with 84,287 in 2022 (32.8% of reports).

From a distribution perspective, the greatest increase in percent of reports in 2022 compared to 2021 occurred with event type Error Related to P/T/T, which increased by 1.5 percentage points, from 31.3% of reports in 2021 to 32.8% in 2022. The largest decrease occurred with event type Medication Error, which dropped 3.7 percentage points, from 16.9% in 2021 to 13.2% in 2022. This change can primarily be attributed to one facility that reported a much lower number of medication error incident reports in 2022 compared to 2021, accounting for 84% of the overall decrease in this event type.
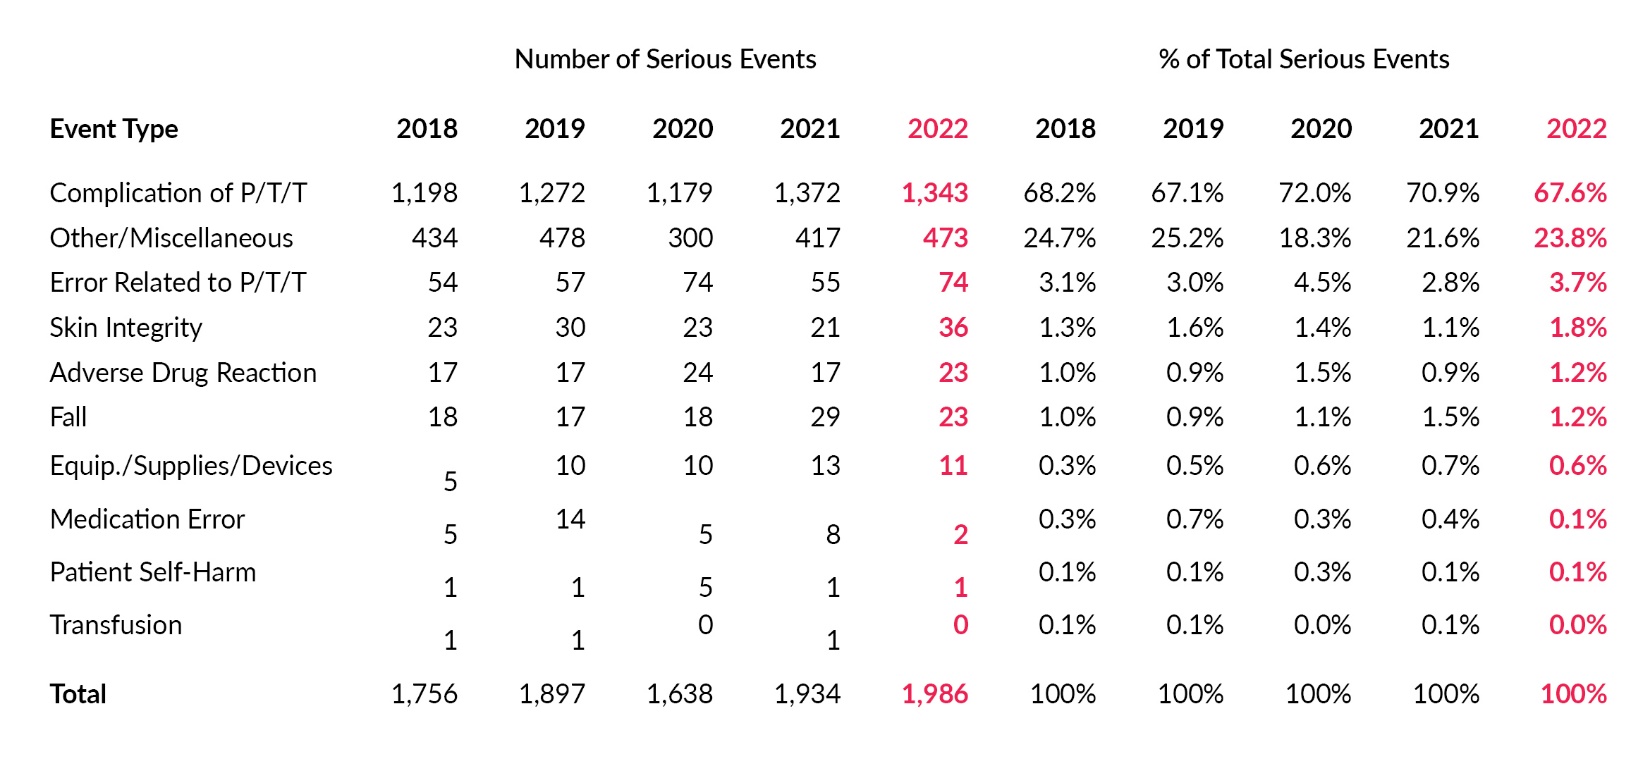
The number and percentage of serious events submitted for each event type for the past five years are shown in Table 5. In 2022, Complication of P/T/T represented 15.6% of total reports and accounted for the majority (53.5%) of serious event reports. In terms of distribution, Adverse Drug Reactions showed the largest increase among serious event reports, increasing by 1.1 percentage points. The largest decrease was with Complication of P/T/T, which dropped 0.8 percentage points in 2022.

Event Subtypes
Each of the 10 main event types has between six and 13 subtypes to further classify the event. The total number of reports and serious events, as well as their associated percentage distributions, are shown in Table 6. This is a detailed accounting of reports submitted in 2022 by the first level of subtype for each main event type. The main event types in the left column are listed in descending order by their number of reports (i.e., the same ordering as Table 4). Within each main event type, the subtypes are listed in descending order as well.
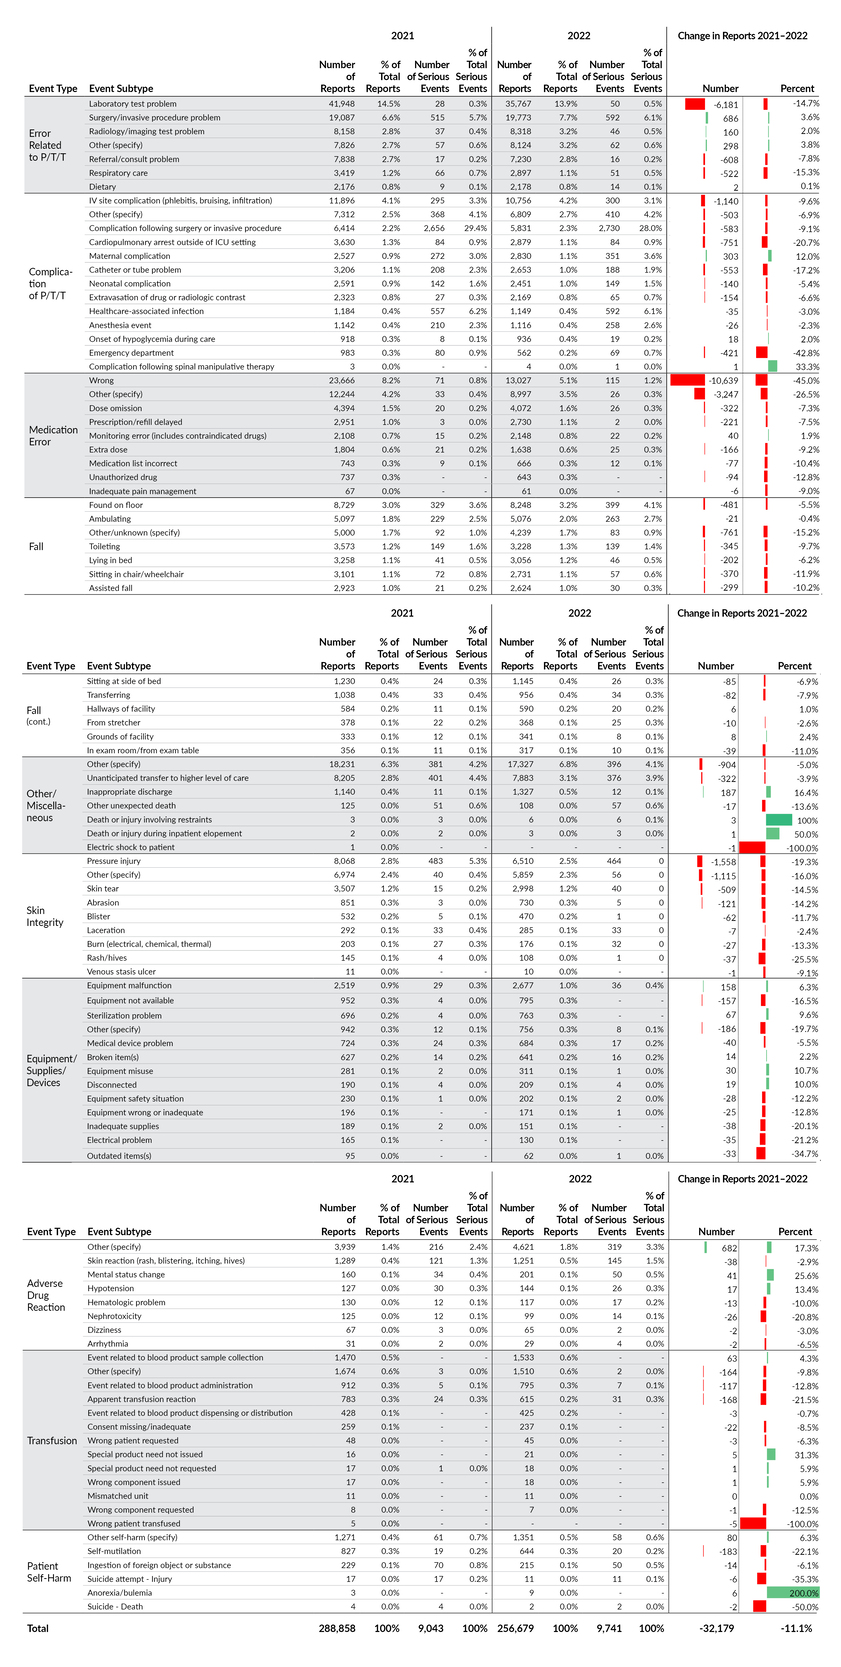
While the total number of reports decreased by 32,179 from 2021 to 2022, a large percentage of the decrease (43.2% or 13,912 reports) was due to decreases in three event subtypes, each of which had a single facility comprising at least 75% of the decrease. These three subtypes are Medication Error–Wrong, Medication Error–Other (specify), and Adverse Drug Reaction–Nephrotoxicity.
There were another eight event subtypes for which two to five facilities collectively comprised at least 75% of the decrease. These eight subtypes, which accounted for 27.1% (8,761 reports) of the overall decrease in reports, were as follows: Equipment/Supplies/Devices–Inadequate supplies, Patient Self-Harm–Self-mutilation, Complication of P/T/T–Cardiopulmonary arrest outside of ICU setting, Complication of P/T/T–Emergency Department, Skin Integrity–Other (specify), Skin Integrity–Rash/hives, Equipment/Supplies/Devices–Electrical problem, and Error Related to P/T/T–Laboratory test problem.
If the decreases of 13,912 and 8,761 referenced above are combined, we have a total decrease in reports of 22,673, accounting for 70.5% of the overall decrease of 32,179.
Event Type and Harm Score
Table 7 displays a cross tabulation of submitted reports distributed by harm score for each of the 10 main event types. Colored cells reflect the intersections of event type and harm score that occurred most frequently in 2022, with darker shades representing higher concentrations of reports. For the most frequently reported event type, Error Related to P/T/T, harm score C was reported most frequently; this intersection of event type and harm score was the most common in 2022, with a total of 41,154 reports and representing 16.0% of all reports, increasing from 15.2% of all reports in 2021.

The next most common intersection was with event type Complication of P/T/T and harm score D, with a total of 20,975 reports and representing 8.2% of all reports (the same percentage as 2021).
Care Area and Harm Score
The care area (i.e., location where the event occurred) can help us determine whether there are patterns or trends in reports of specific patient safety concerns related to the location where care is delivered. Within the acute care data, there are 168 care areas for facilities to identify where events occur. We then place these care areas into one of 23 care area groups to produce a cross tabulation with harm score. In Table 8 we show a cross tabulation of care area group with harm score. This reflects the same two areas of highest concentration as seen in the 2021 data, in the cross sections of the Med/Surg care area group and harm scores C and D. Together these two cells in the cross tabulation account for 16.0% of all reports in 2022.

Care Area and Event Type
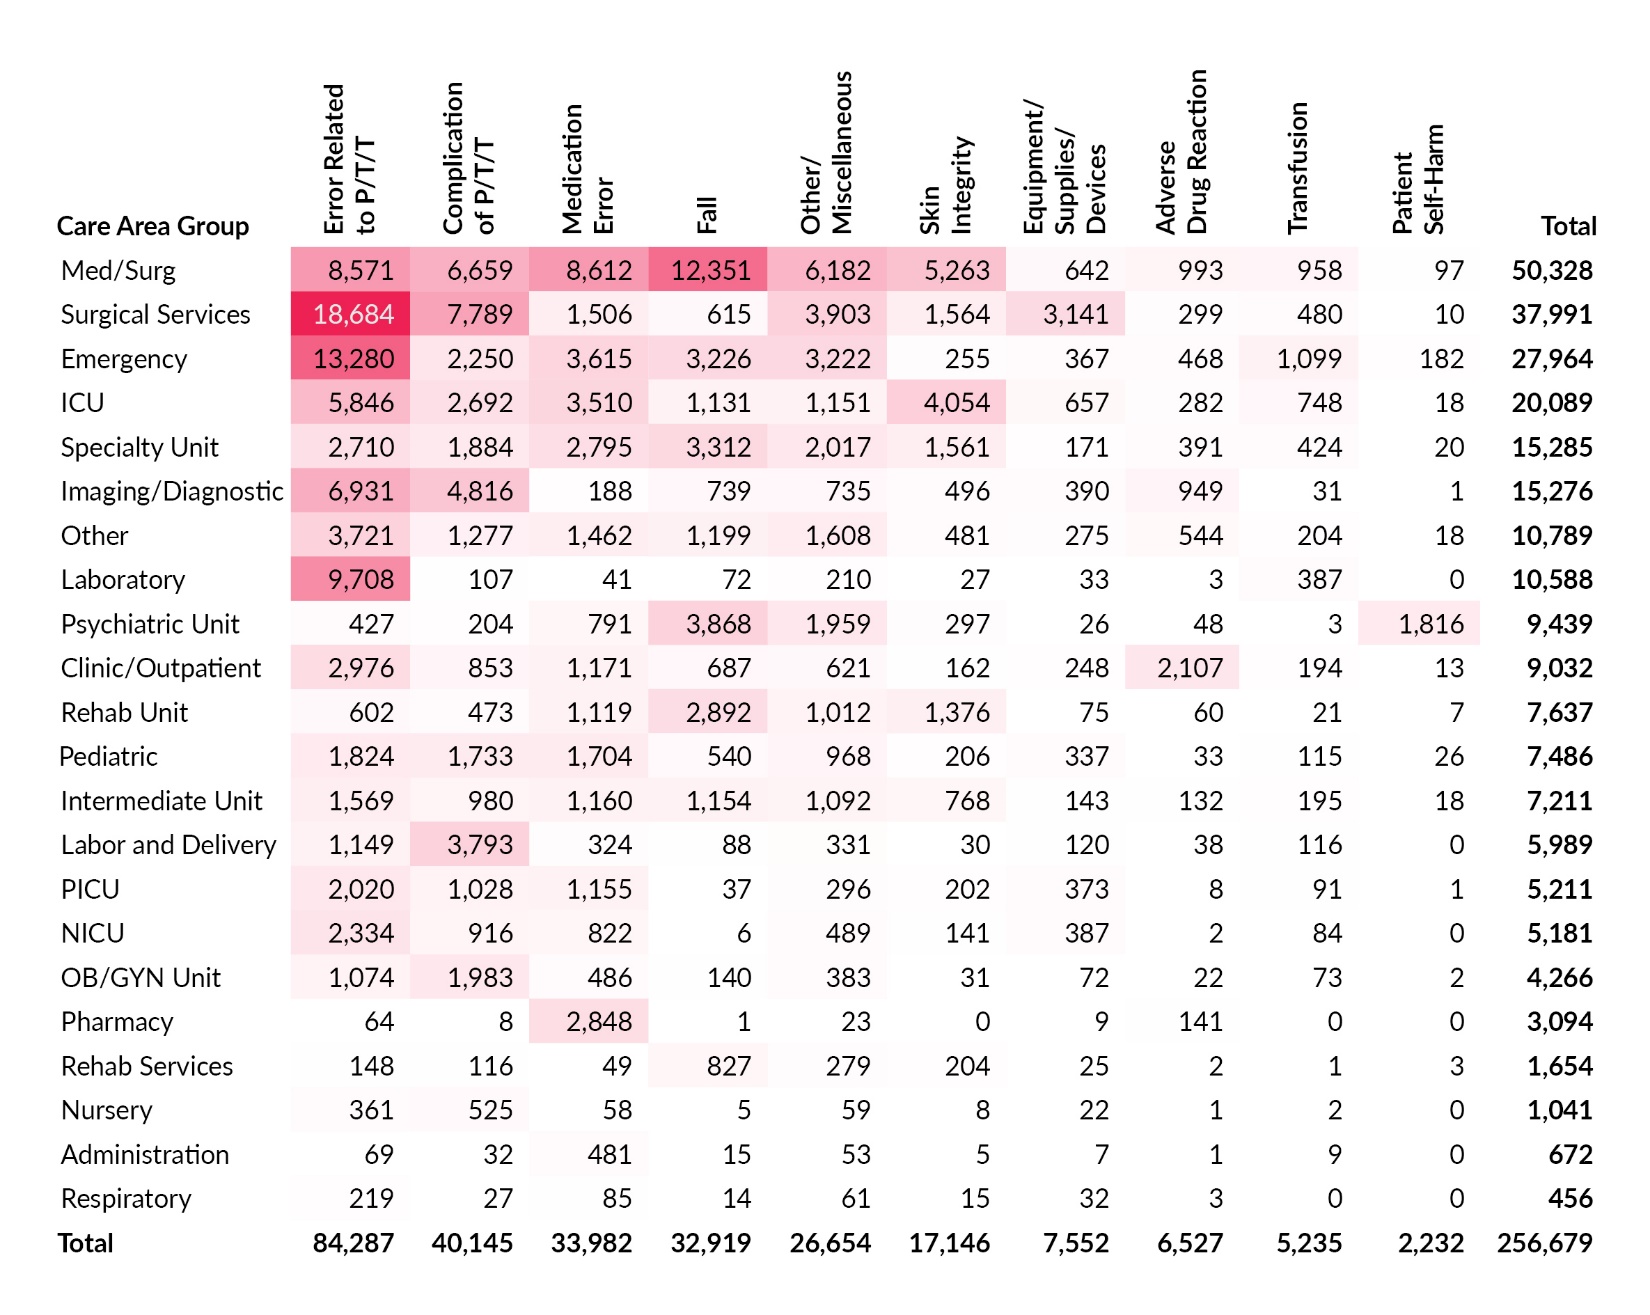
Table 9 shows a cross tabulation of care area group and event type. The two highest concentrations of reports are at the intersections of Error Related to P/T/T with Surgical Services (n=18,684) and Emergency (n=13,280) care area groups. The third highest concentration is seen at the intersection of Fall and Med/Surg (n=12,351). These are the same three areas of highest concentration that were seen in the 2021 data.

Other Acute Care Facilities
Given that the acute care data predominately reflects reports from hospitals, it is important to separately analyze data from the other acute care facilities that report to PA-PSRS (comprised mostly of ASFs, along with BRCs and ABFs). Table 10 shows the distribution of all reports submitted by these other acute care facilities across the 10 main event types in 2022. These facilities show a different distribution compared to the overall data in Table 4. In 2022, they reported medication error and fall events less frequently than other event types when compared to the overall data (see Tables 4 and 10). The three event types reported most frequently were Error Related to P/T/T, Other/Miscellaneous, and Complication of P/T/T, which together account for 91.2% of all reports submitted by these facilities in 2022. Table 11 shows the distribution of serious events reported by other acute care facilities in 2022; the Complication of P/T/T event type accounted for over two-thirds of these reports.

Discussion
While we are unable to reach a firm conclusion as to the primary reason for the decrease in reports of incidents and increase in reports of serious events to PA-PSRS in 2022, many factors are likely involved. Based on an analysis of the PA-PSRS data alone, more than half of the overall decrease can be attributed to a few facilities that submitted a much lower number of incidents in 2022 compared to 2021. PSA has been working with facilities to identify and correct issues and will continue to monitor their reporting and take further action as needed. Throughout the year, PSA provided ongoing support and education for facilities regarding the accurate reporting of events and contacted patient safety officers in many facilities regarding reports classified as incidents that appeared to describe serious events or nonreportable situations.
Conclusion
There was a decrease in the number of incidents submitted to PA-PSRS in 2022, an increase in serious and high harm event reports, and shifts in the number and distribution of reports for certain event types and subtypes. There was a notable change in reporting activity by three facilities, which had a considerable impact on the number, rate, and types of events reported in 2022. PSA will continue to monitor reporting and take further action as needed.
Note
This analysis was exempted from review by the Advarra Institutional Review Board.
Disclosure
The authors declare that they have no relevant or material financial interests.
About the Authors
Shawn Kepner (shawkepner@pa.gov) is a data scientist at the Patient Safety Authority.
Rebecca Jones is director of Data Science and Research at the Patient Safety Authority (PSA) and founder and director of the PSA’s Center of Excellence for Improving Diagnosis.
PA-PSRS is a secure, web-based system through which Pennsylvania hospitals, ambulatory surgical facilities, abortion facilities, and birthing centers submit reports of patient safety–related incidents and serious events in accordance with mandatory reporting laws outlined in the Medical Care Availability and Reduction of Error (MCARE) Act (Act 13 of 2002).1 All reports submitted through PA-PSRS are confidential and no information about individual facilities or providers is made public.
The Pennsylvania Health Care Cost Containment Council (PHC4) is an independent state agency responsible for addressing the problem of escalating health costs, ensuring the quality of healthcare, and increasing access to healthcare for all citizens regardless of ability to pay. PHC4 has provided data to this entity in an effort to further PHC4’s mission of educating the public and containing healthcare costs in Pennsylvania. PHC4, its agents, and its staff have made no representation, guarantee, or warranty, express or implied, that the data—financial-, patient-, payor-, and physician-specific information—provided to this entity are error-free, or that the use of the data will avoid differences of opinion or interpretation. This analysis was not prepared by PHC4. This analysis was done by the Patient Safety Authority. PHC4, its agents, and its staff bear no responsibility or liability for the results of the analysis, which are solely the opinion of this entity.