Introduction
Across the general population in the United States, the rate of suicide, for the most part, increased year over year between 2000 and 2018, and then plateaued from 2018 to 2023.1 During 2023, more than 49,000 people completed a suicide; 80% were male, and those age ≥85 were most likely to complete a suicide.1 During 2023, the rate of suicide across the general U.S. population was 14.1 per 100,000 people.1
According to a meta-analysis, the rate of suicide in U.S.-based psychiatric facilities was 262 per 100,000 inpatient years.2 While there have been numerous studies within the past 25 years that explored the occurrence of suicide among inpatient psychiatric units, a large majority of the studies were of patient populations outside of the United States.3–19 There is value in considering findings from studies of non-U.S. patient populations; nevertheless, findings from foreign studies may differ from U.S.-based studies due to differences in regulations, policies, practices, resources, and cultures. As a result, there is a strong need for continued research of psychiatric inpatient suicide events within the U.S. population.
There is also a need to sharpen the focus on inpatient psychiatric events by examining suicide-related events (attempted suicides and suicides) that only occurred within the unit, unlike much of the prior literature that combined on-site events with those that occurred off-site (e.g., during absconding, authorized leave, or shortly after discharge).3,5,7,8,10,11,16,19–21 To further complicate interpretation of findings from prior studies, it appears that off-site events are more frequent than on-site5,7,8,16,19,20; therefore, insights from many of the prior studies could be misleading for estimating conditions of risk specific to on-site events.
The purpose of this retrospective mixed-methods study of Pennsylvania Patient Safety Reporting System (PA-PSRS) event reports was to analyze factors associated with suicide-related events that occurred within inpatient psychiatric units. This study systematically explored several understudied combinations of variables, such as attempted suicide versus suicide by patient gender, patient age, event location, method, objects involved, and multiple temporal variables. A notable contribution to the literature is our analysis of suicide-related events in relation to several temporal variables: event month, event day of week, event time of day, and days from admission to event occurrence. In addition, some of the analyses were stratified by three variables (e.g., attempted suicide vs. suicide by gender by event month), which reveals further nuance rarely addressed in prior research. The findings are intended to inform stakeholders and guide refinement of strategies to prevent suicide-related events within inpatient psychiatric settings.
Methods
Data Source and Sample
Data for this study were obtained from event reports submitted by licensed healthcare facilities to the PA-PSRS acute care database, which comprises reports submitted by acute and ambulatory healthcare facilities. Pennsylvania law requires the reporting of patient safety events, ranging from near misses to events resulting in serious harm.22 Although event reports do not include medical records, they contain structured fields (e.g., event date, patient age, care area) and unstructured narrative fields that summarize the conditions and actions associated with the event.
Our query of the PA-PSRS database applied the following criteria:
-
Event dates: 1/1/2016–12/31/2025 (10-year period)
-
Care area group[1]: Psychiatric unit
-
Event type: Patient self-harm
-
Event subtypes: (1) Suicide-Death, (2) Suicide Attempt-Injury, (3) Self-mutilation, (4) Ingestion of foreign object or substance, (5) Anorexia/bulimia, and (6) Other self-harm (specify). All reports categorized under subtypes 1 and 2 were included in the final dataset. For subtypes 3–6, the following keyword criteria were applied to include reports that involved suicide-related events: “suicid,” “die,” “dead,” “death,” “kill,” “life,” “living,” “live,” and “born.”
The query produced 219 PA-PSRS event reports. The first author then manually reviewed the 219 event reports and applied the following inclusion criteria:
-
The event occurred within an inpatient psychiatric unit (i.e., postdischarge and off-site suicides and attempts were not included).
-
The event met one of the following conditions:
-
Within PA-PSRS, the event report was assigned to the subtype Suicide-Death or Suicide Attempt-Injury.
-
The event report described a suicide or attempted suicide in one or more of the free-text fields. The determination of whether it was an attempted suicide or suicide, as opposed to nonsuicidal self-harm, was based on (1) phrases used by the patient (e.g., “I was trying to kill myself,” “I want to die,” “I don’t want to live”), and/or (2) conclusions made by the staff (e.g., “it appears that the patient was attempting suicide).”
-
After applying the inclusion criteria, the final study sample comprised 143 event reports.
Design, Analysis, and Variables Coded
We employed a retrospective mixed-methods design. A portion of the data were analyzed using an exploratory sequential approach, in which qualitative analysis preceded and informed subsequent quantitative analysis. Qualitative data from PA-PSRS event reports were examined through directed content analysis,23,24 guided by a framework method25–27 and informed in part by categories of variables identified in prior literature.28–30 The variables were measured by frequency and evaluated using descriptive analysis. Descriptive analysis, a quantitative approach, is used to explore phenomena and identify patterns to enhance understanding and explain their occurrence.31,32 This is often achieved through visual displays that illustrate relationships among multiple variables and support triangulation of findings.
Independent of the qualitative analysis and descriptive analyses, some of the data were appropriate for statistical testing, such as suicide-related events by patient age, event month, event day of week, and event time of day. Where appropriate, a Fisher’s exact test or chi-square test was used to determine whether frequency deviations exist from expected uniform distributions across categories. An alpha level of 0.05 was applied for all statistical tests.
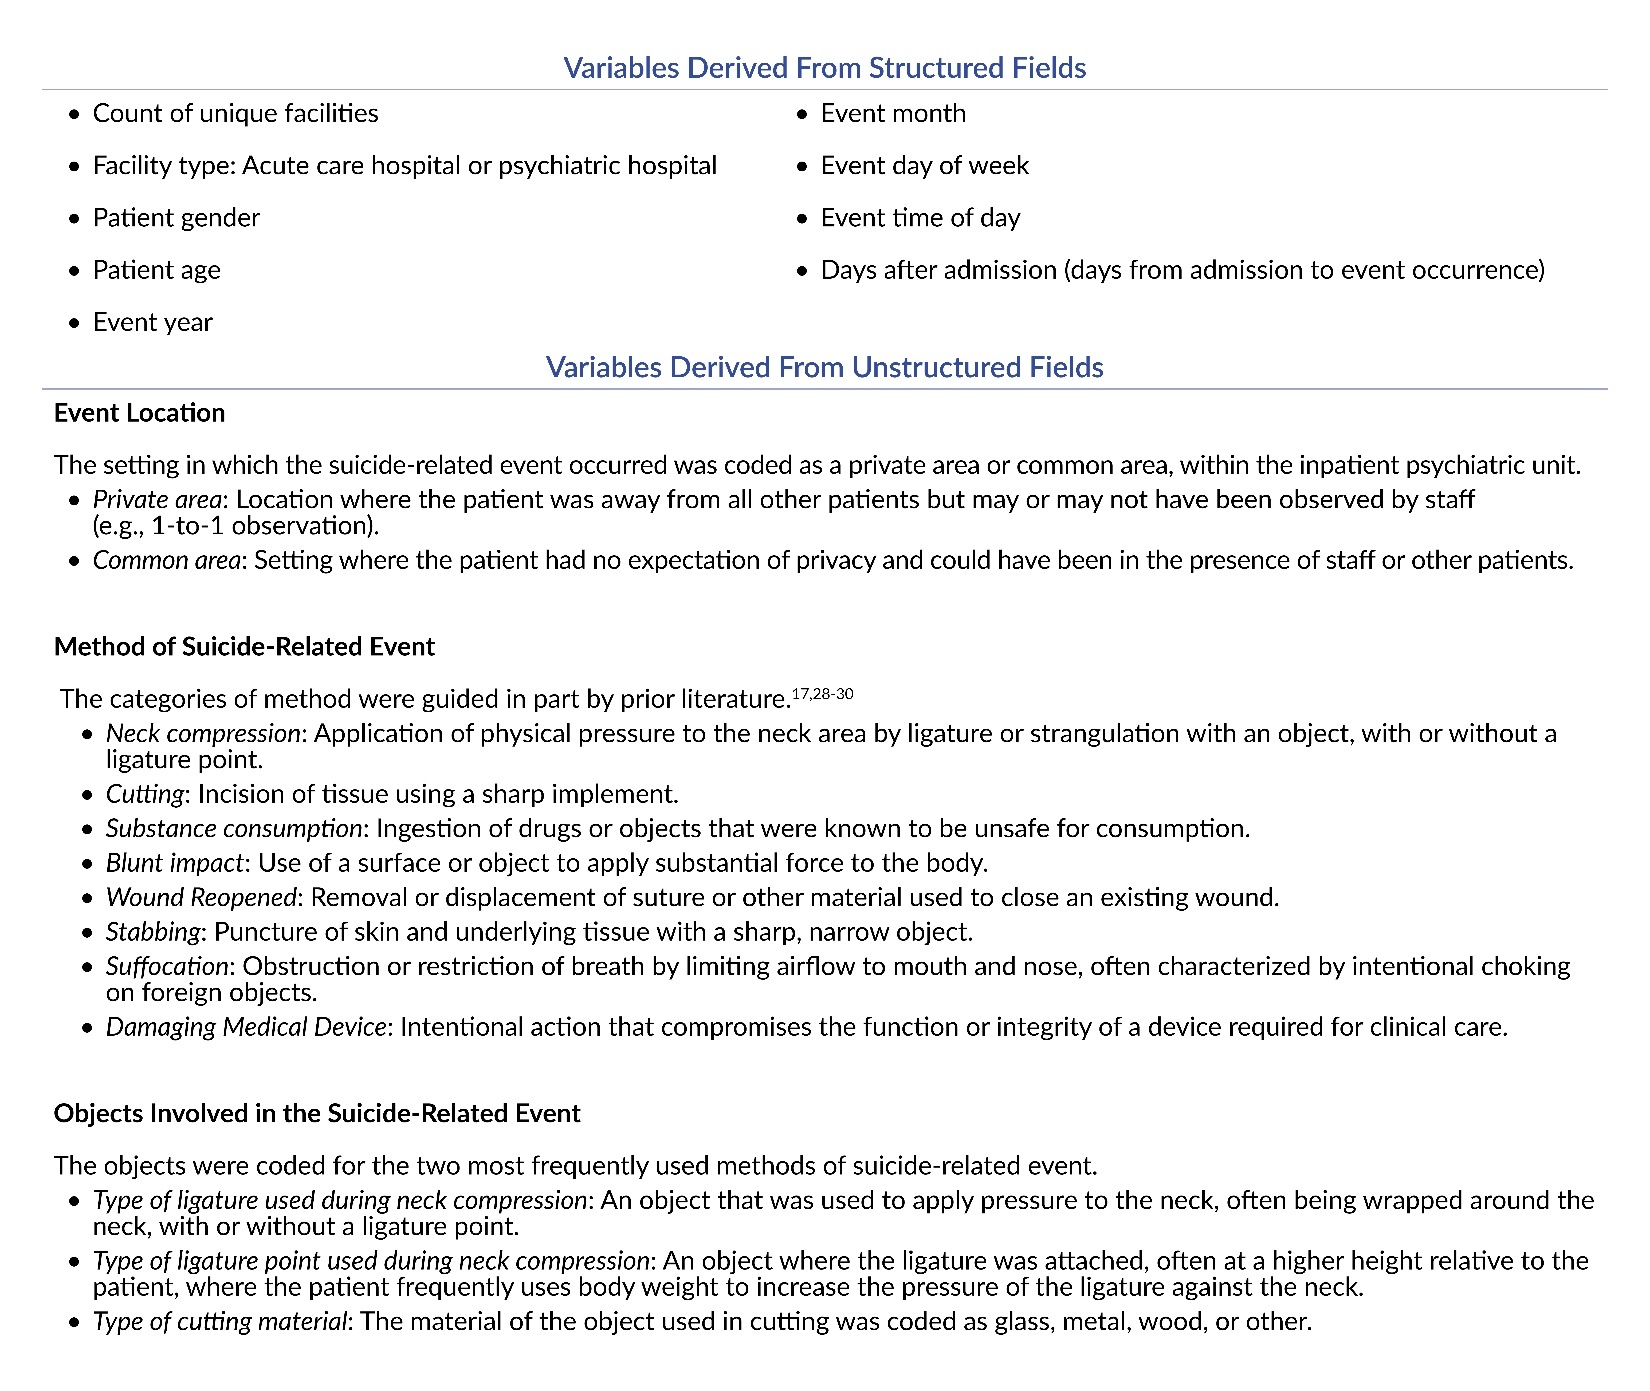
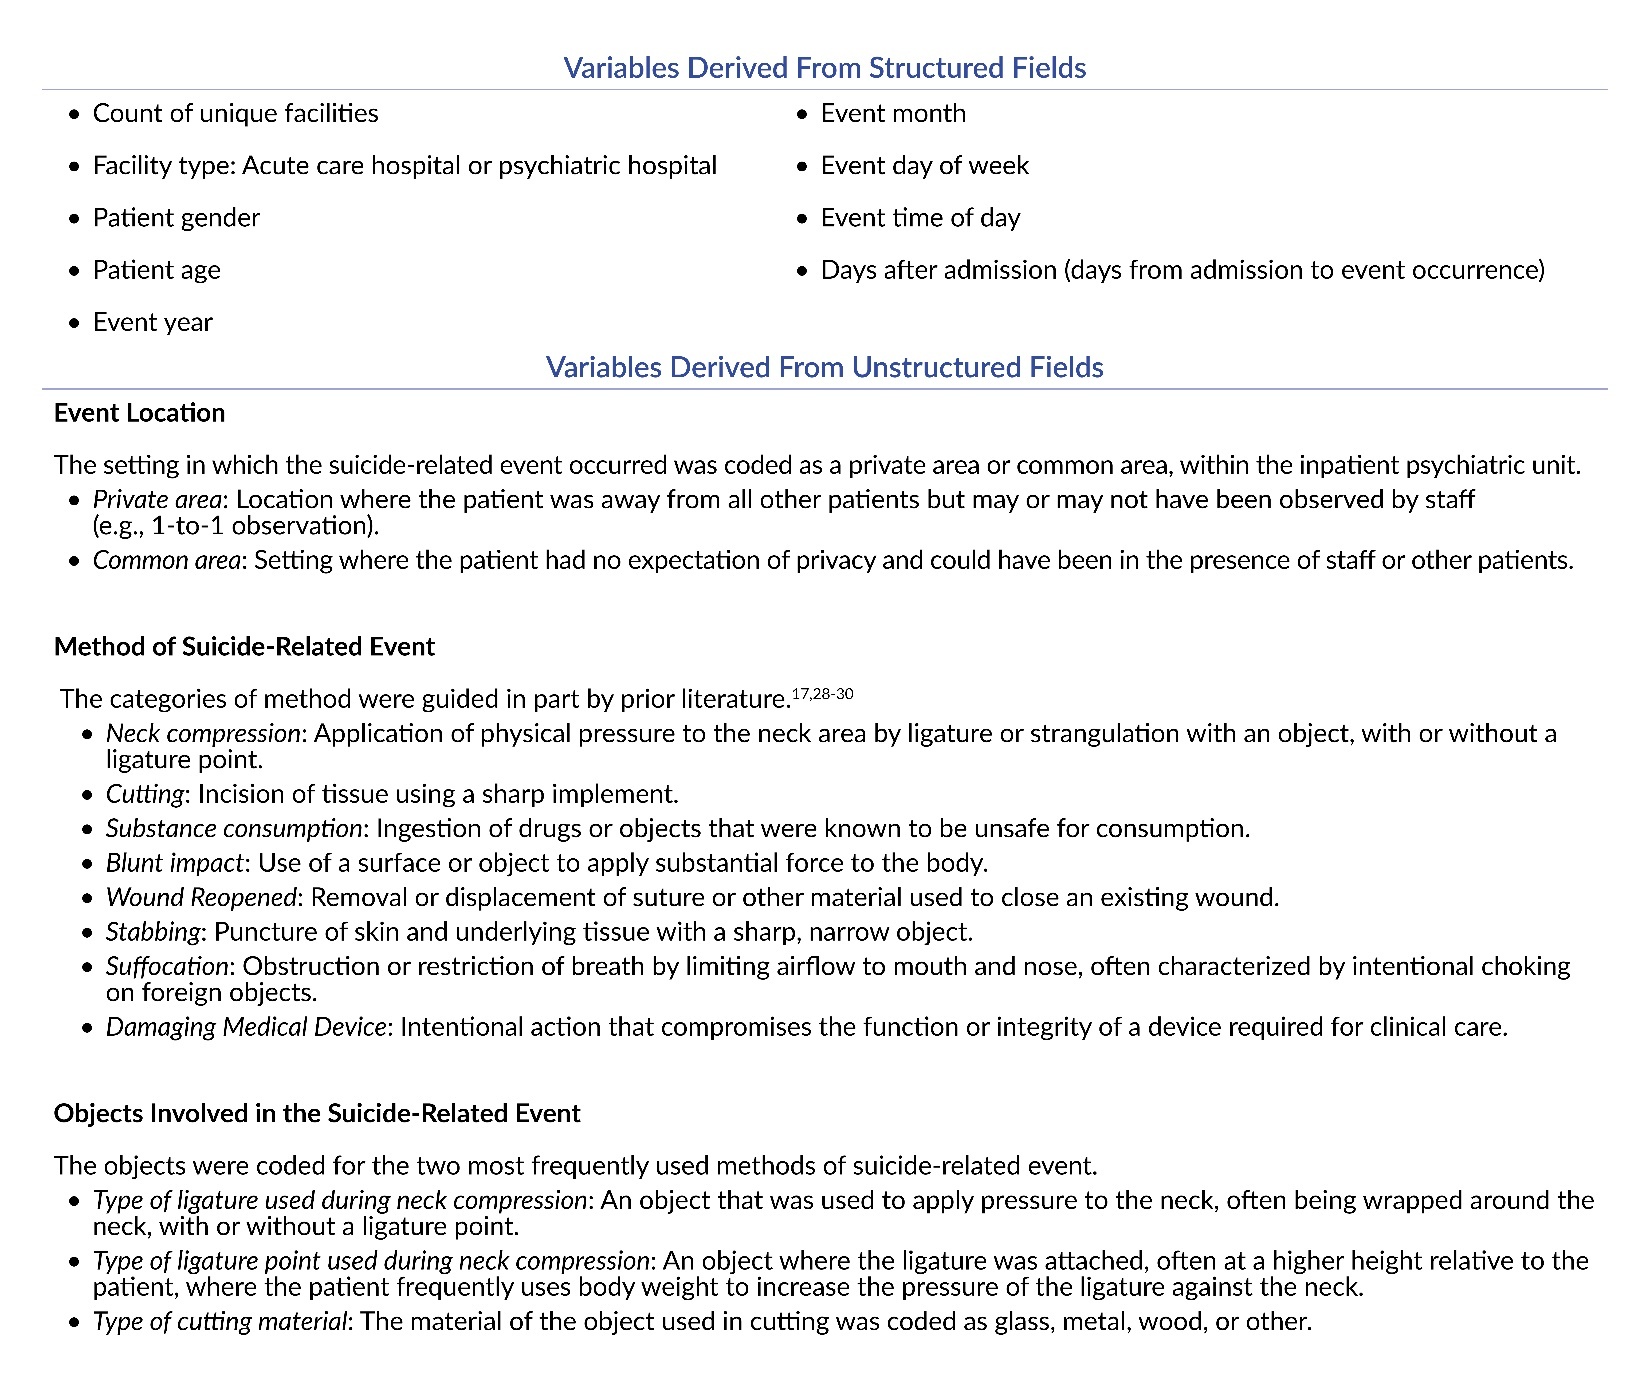
The qualitative and quantitative analyses were applied to variables derived from structured and unstructured fields within PA-PSRS. The variables are listed in Table 1.
Results
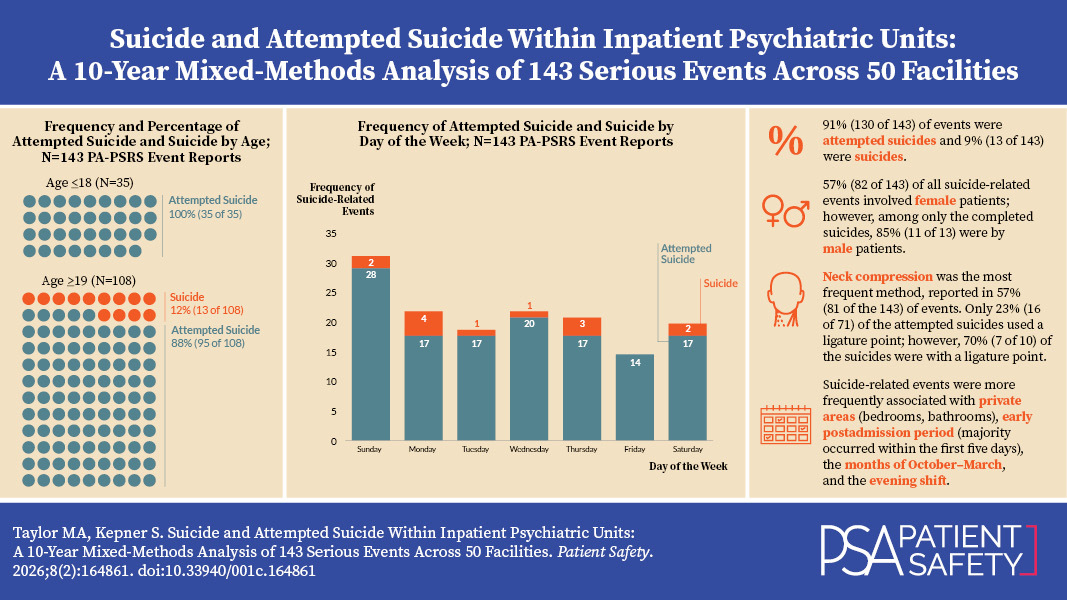
Within Pennsylvania inpatient psychiatric units and over a 10-year-period, a total of 143 suicide-related events were reported, which consisted of 91% (n=130) attempted suicides and 9% (n=13) suicides. Note that our analysis was limited to events the reporter designated as serious, a classification indicating that the event resulted in injury requiring additional healthcare services or resulted in death.
Facilities
Our analysis revealed that the 143 suicide-related events were distributed across 50 unique facilities with inpatient psychiatric units. Across the 50 facilities, the median number of suicide-related events per facility was 1, but three psychiatric hospitals reported 11–15 suicide-related events during the 10-year period. We also found that 62% (88 of 143) of all suicide-related events occurred at psychiatric hospitals, and the remainder occurred at acute care hospitals (55 of 143). Despite the total percentage of events being greater at psychiatric hospitals, we found that more than half (54%, 7 of 13) of suicides occurred at acute care hospitals. Suicides were reported by a total of 11 facilities.
Patient Gender and Age
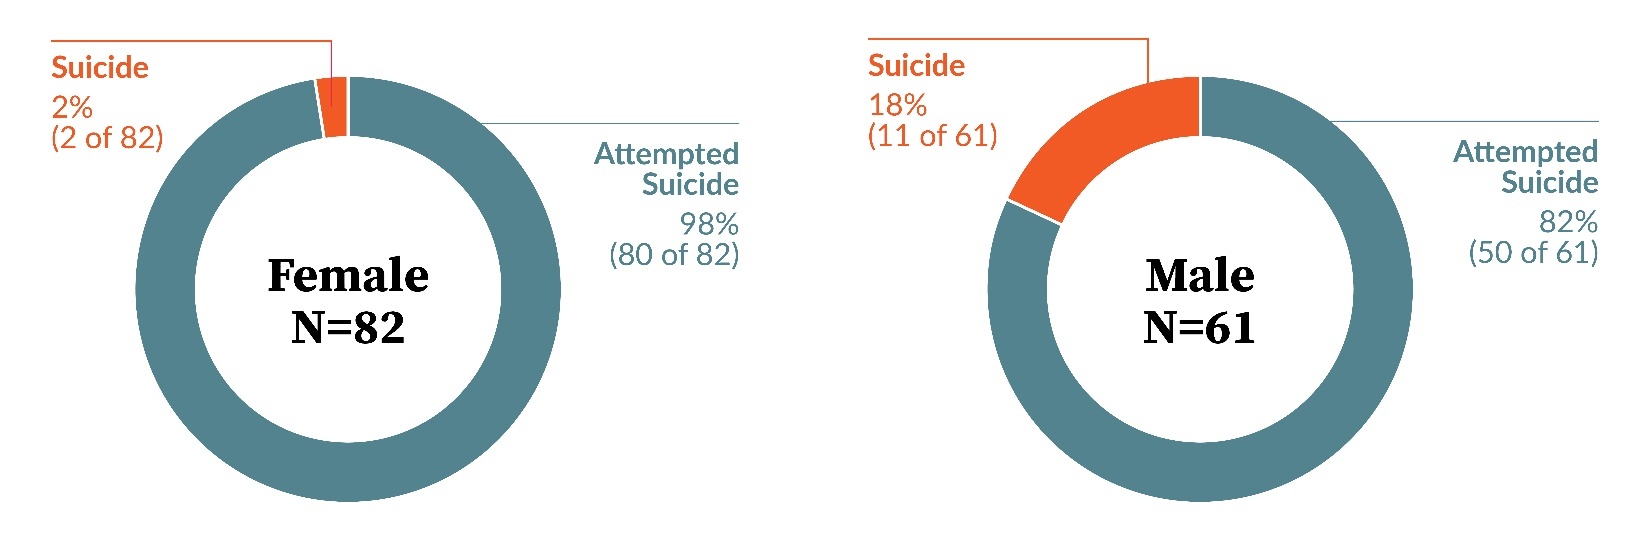
Figure 1 shows a varied distribution of attempted suicides and suicides by gender. Across all suicide-related events, 57% (82 of 143) were by females and 43% (61 of 143) were by males. Among only the suicide events, 85% (11 of 13) were by males and 15% (2 of 13) were by females. In contrast, 62% (80 of 130) of attempted suicide events were by females and 38% (50 of 130) were by males.
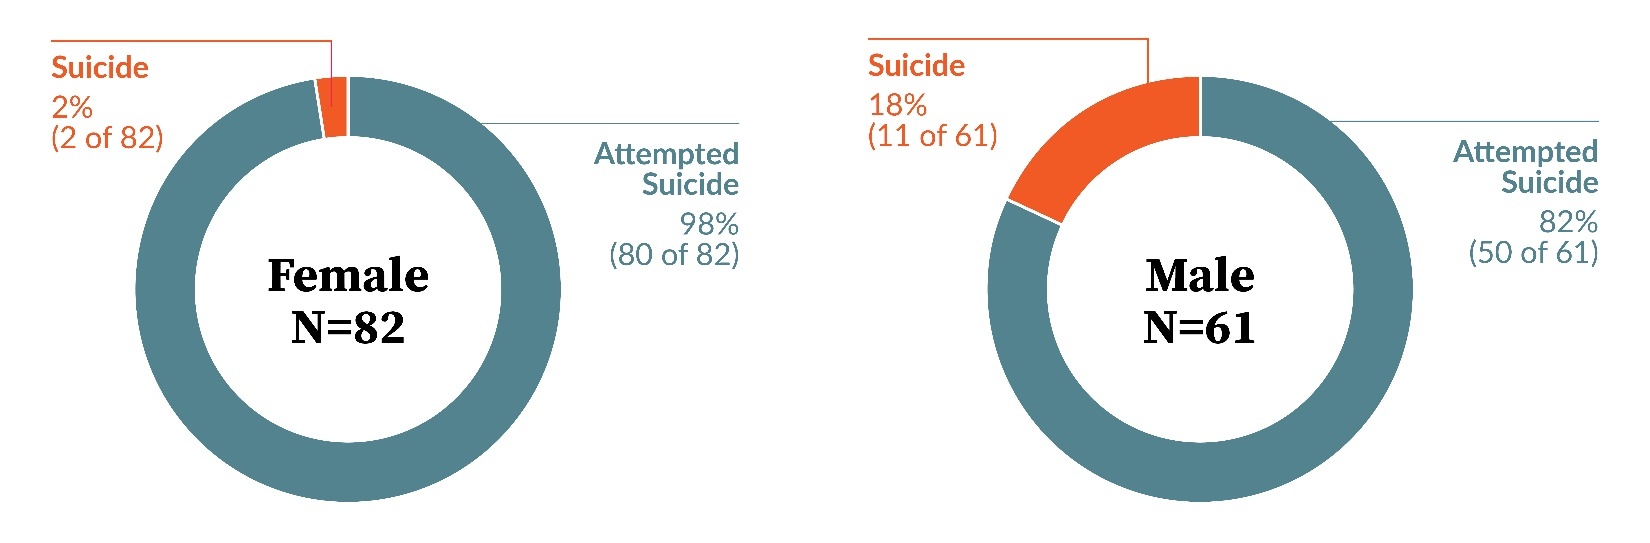
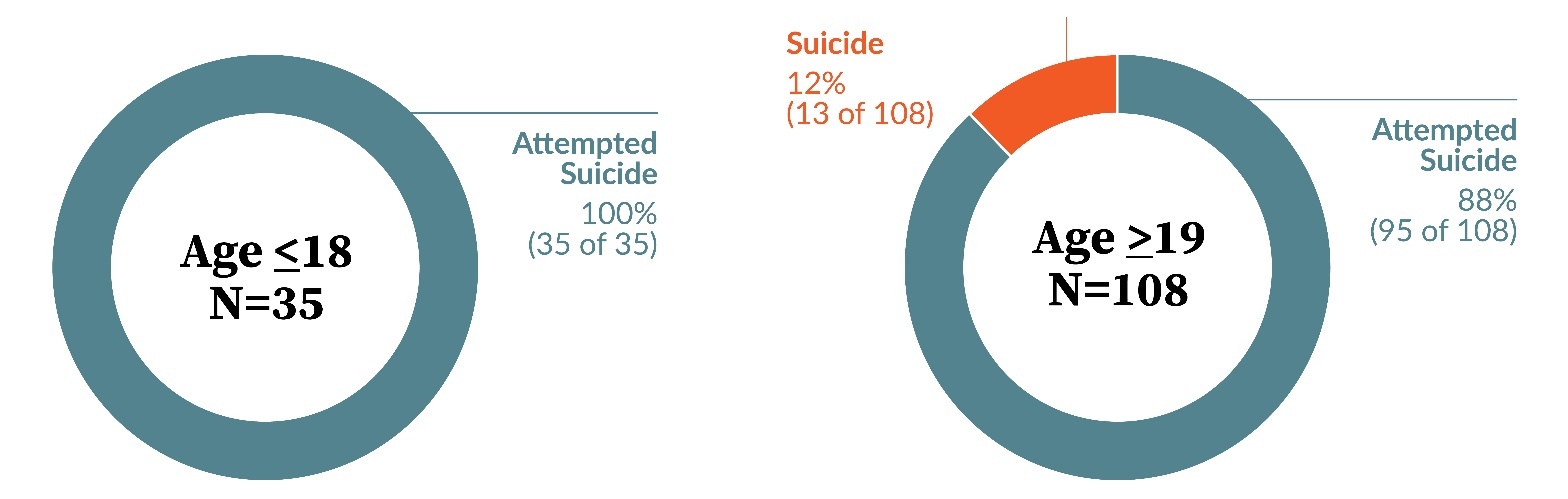
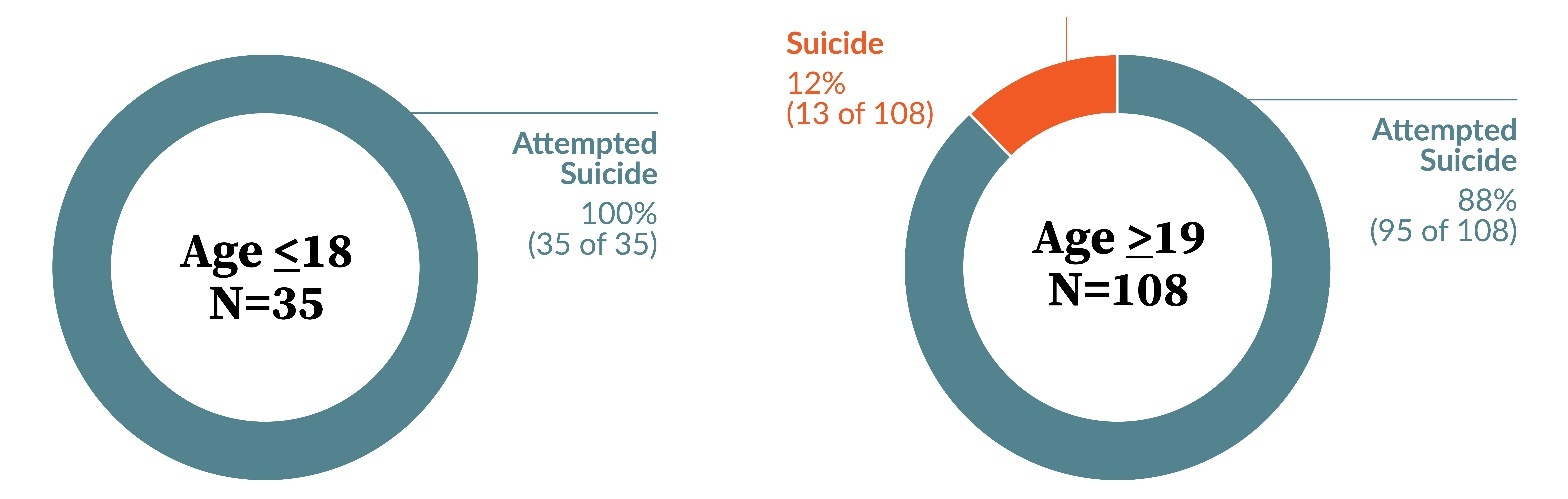
Figure 2 shows that among all suicide-related events, 76% (108 of 143) occurred with patients age ≥19 years and 24% (35 of 143) were by patients age ≤18 years. The figure also reveals that all the suicides were by patients age ≥19 years and none were by patients age ≤18 years. We performed a two-tailed Fisher’s exact test and found a significant (p=0.038) association between patient age (≤18 years vs. ≥19 years) and suicide-related event (attempted suicide vs. suicide).
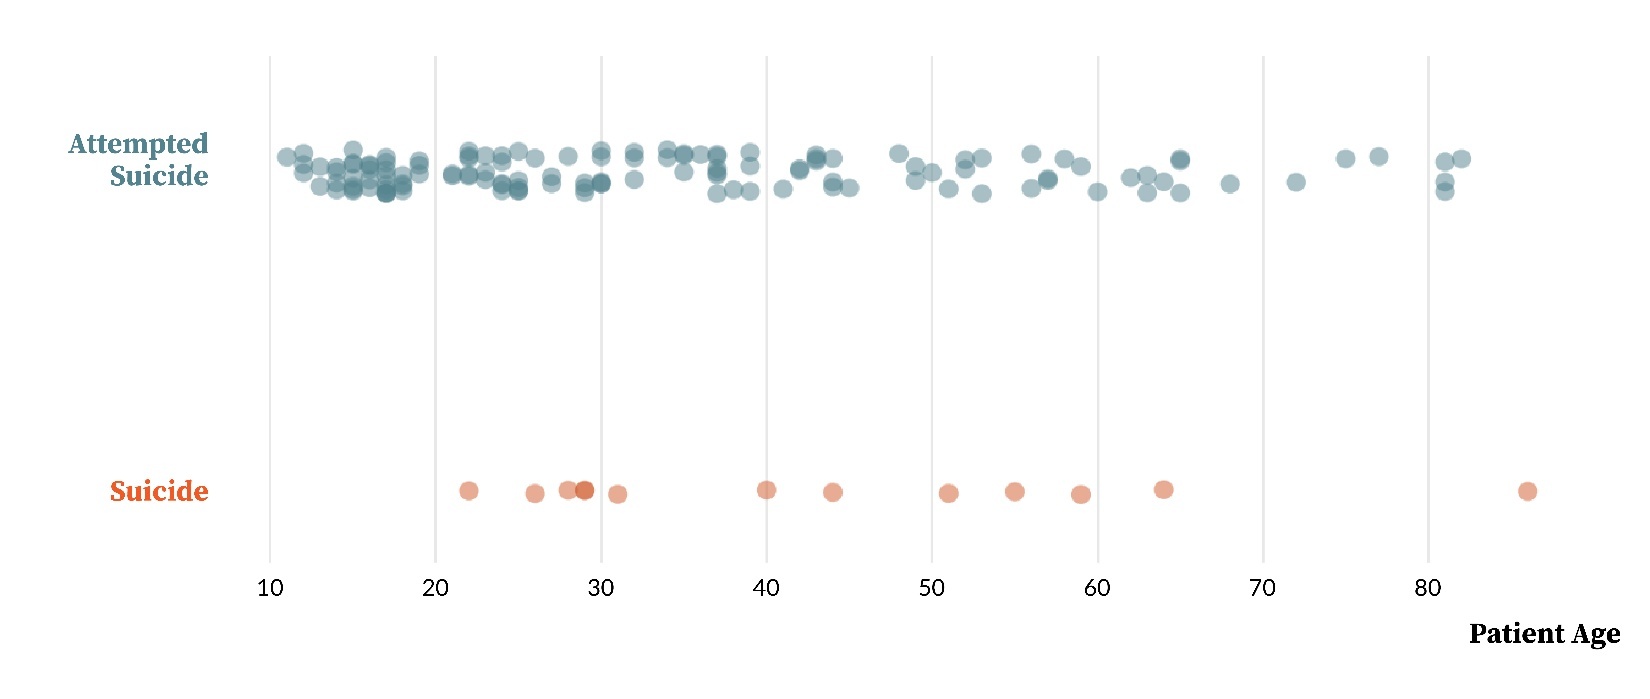
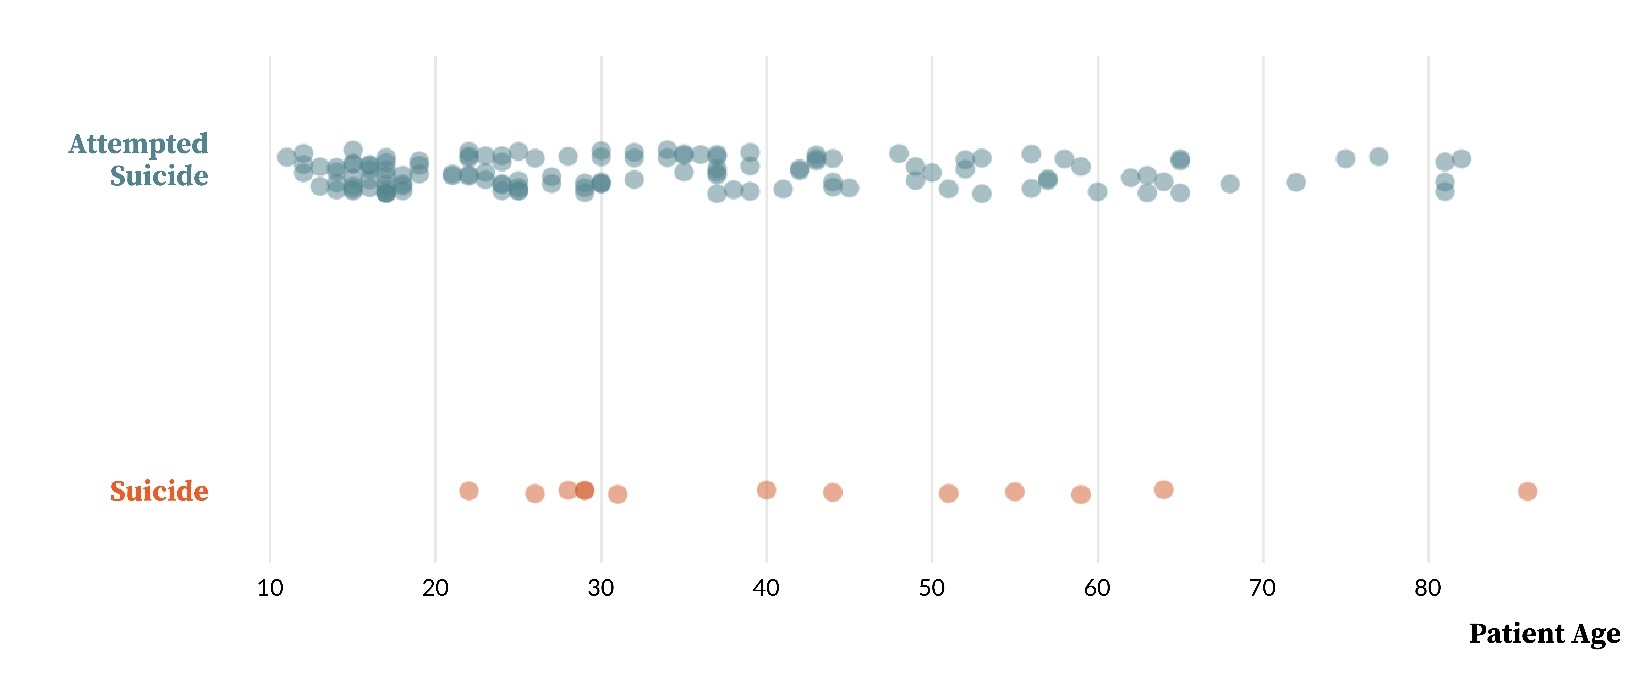
As revealed by Figure 3, the patients’ ages ranged from 11 to 86 years (average=35, second quartile=19, median=30, and third quartile=46.5), with the greatest frequency of suicide-related events occurring at ages 15 years (n=7) and 17 years (n=9). The figure also shows that all suicides were by patients who ranged in age from 22 to 86 years, which is a narrower age range than those who attempted suicide.
Event Year
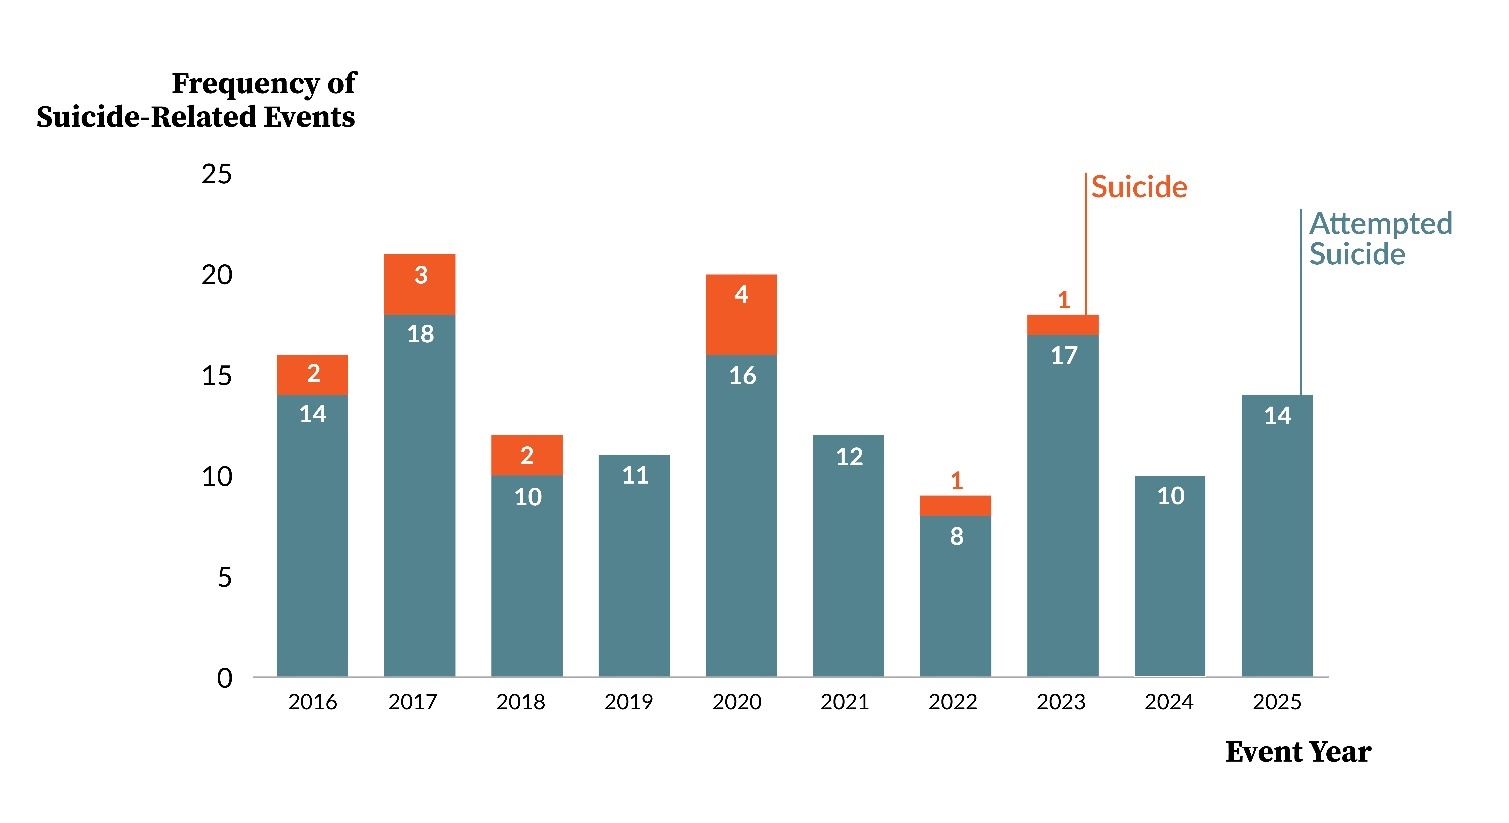
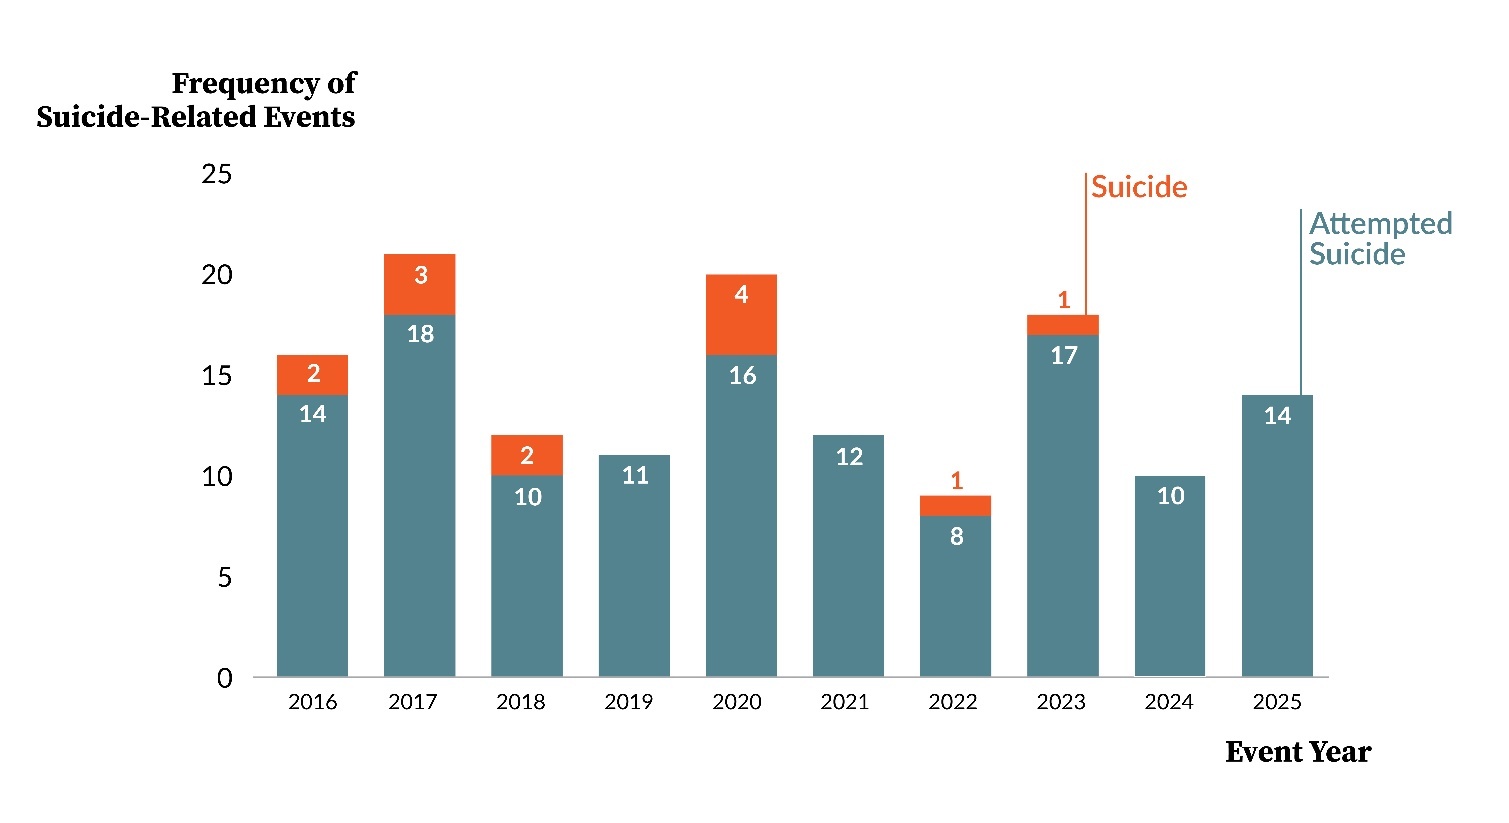
Figure 4 shows that across the 10-year period, the greatest frequency of suicide-related events was in 2017 (n=21) and 2020 (n=20). Also, in 2020 there was a peak of four suicides, yet zero suicides occurred in four of the 10 years (2019, 2021, 2024, and 2025). We also found that during the first five-year period there was a total of 11 suicides, yet there were only 2 suicides in the second five-year period.
Event Month
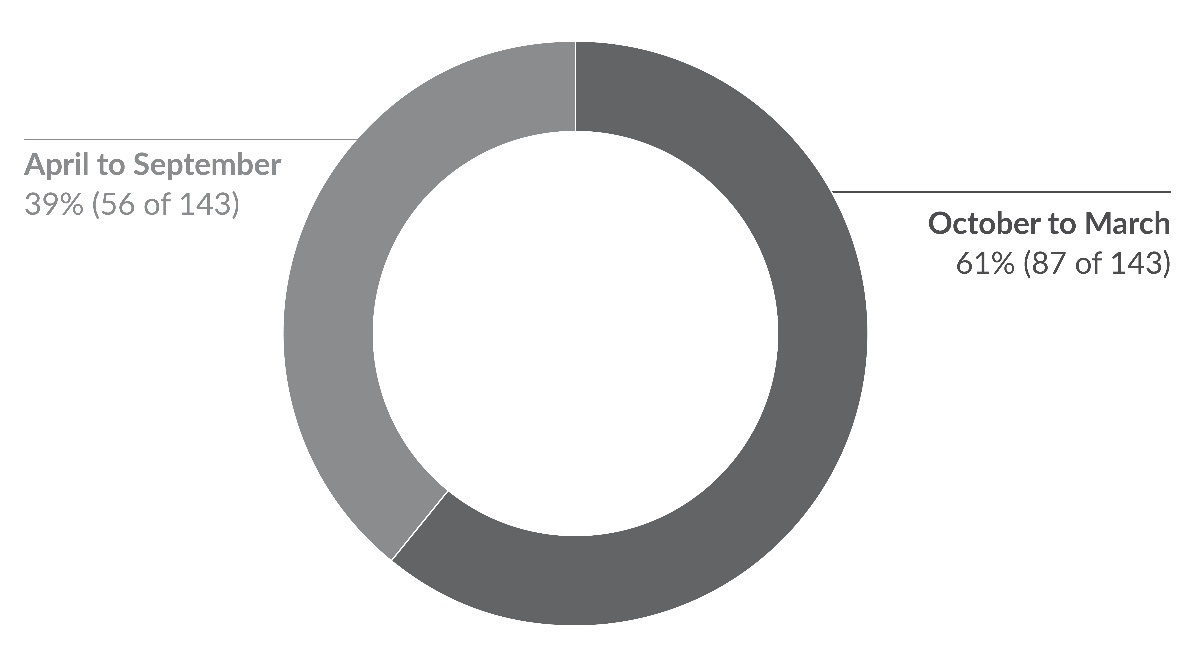
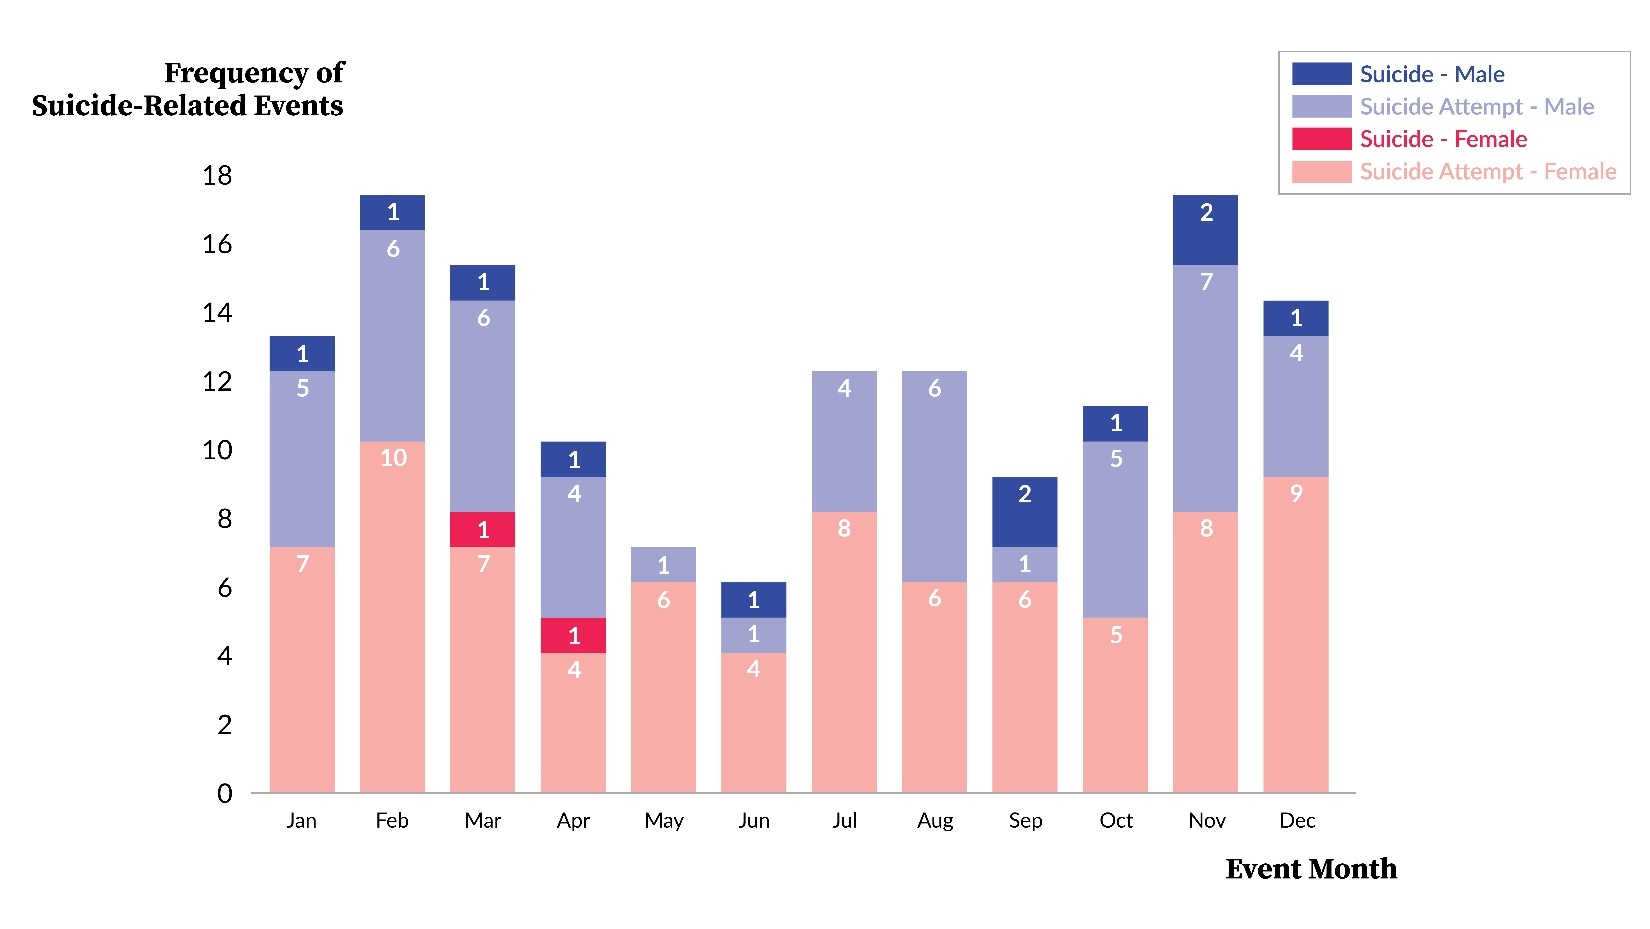
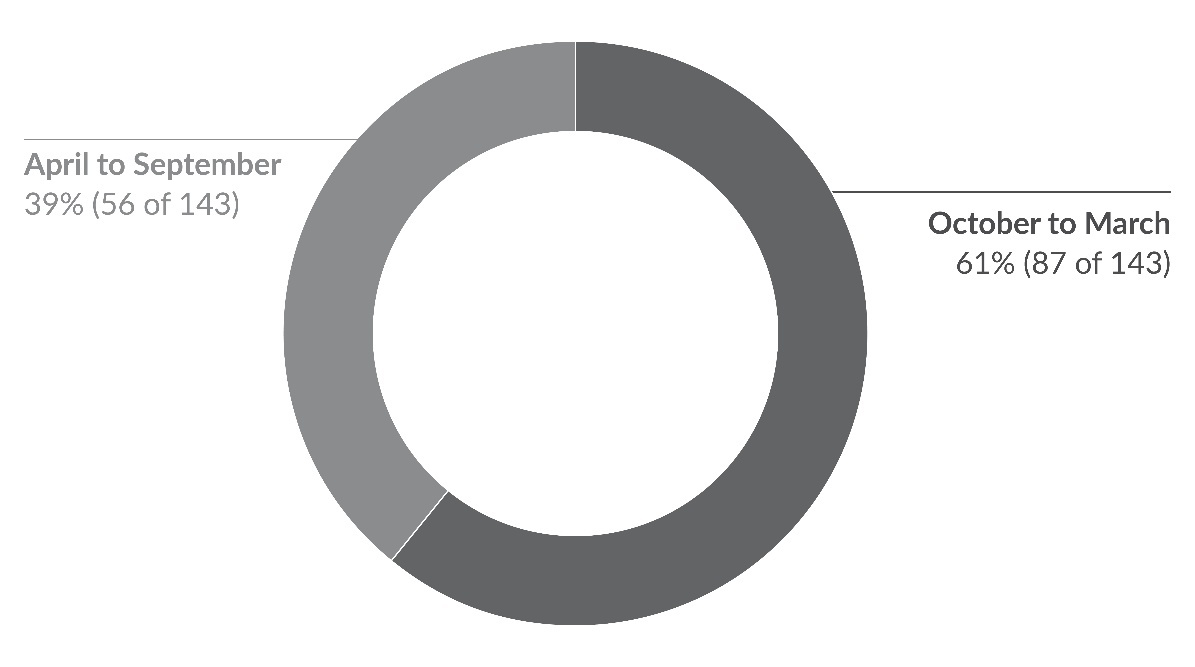
We explored the relation between suicide-related events and event month by analyzing the occurrence across six-month periods. As shown in Figure 5, a majority of suicide-related events (61%, 87 of 143) occurred during the six-month period of October to March, as opposed to April to September (39%, 56 of 143). We used a chi-square test to evaluate the distribution of suicide-related events by six-month period, relative to a uniform distribution. The test revealed that the frequency of suicide-related events during October to March were significantly greater than the expected value from a uniform distribution, X2(1,143) = 6.72, p=0.0095.
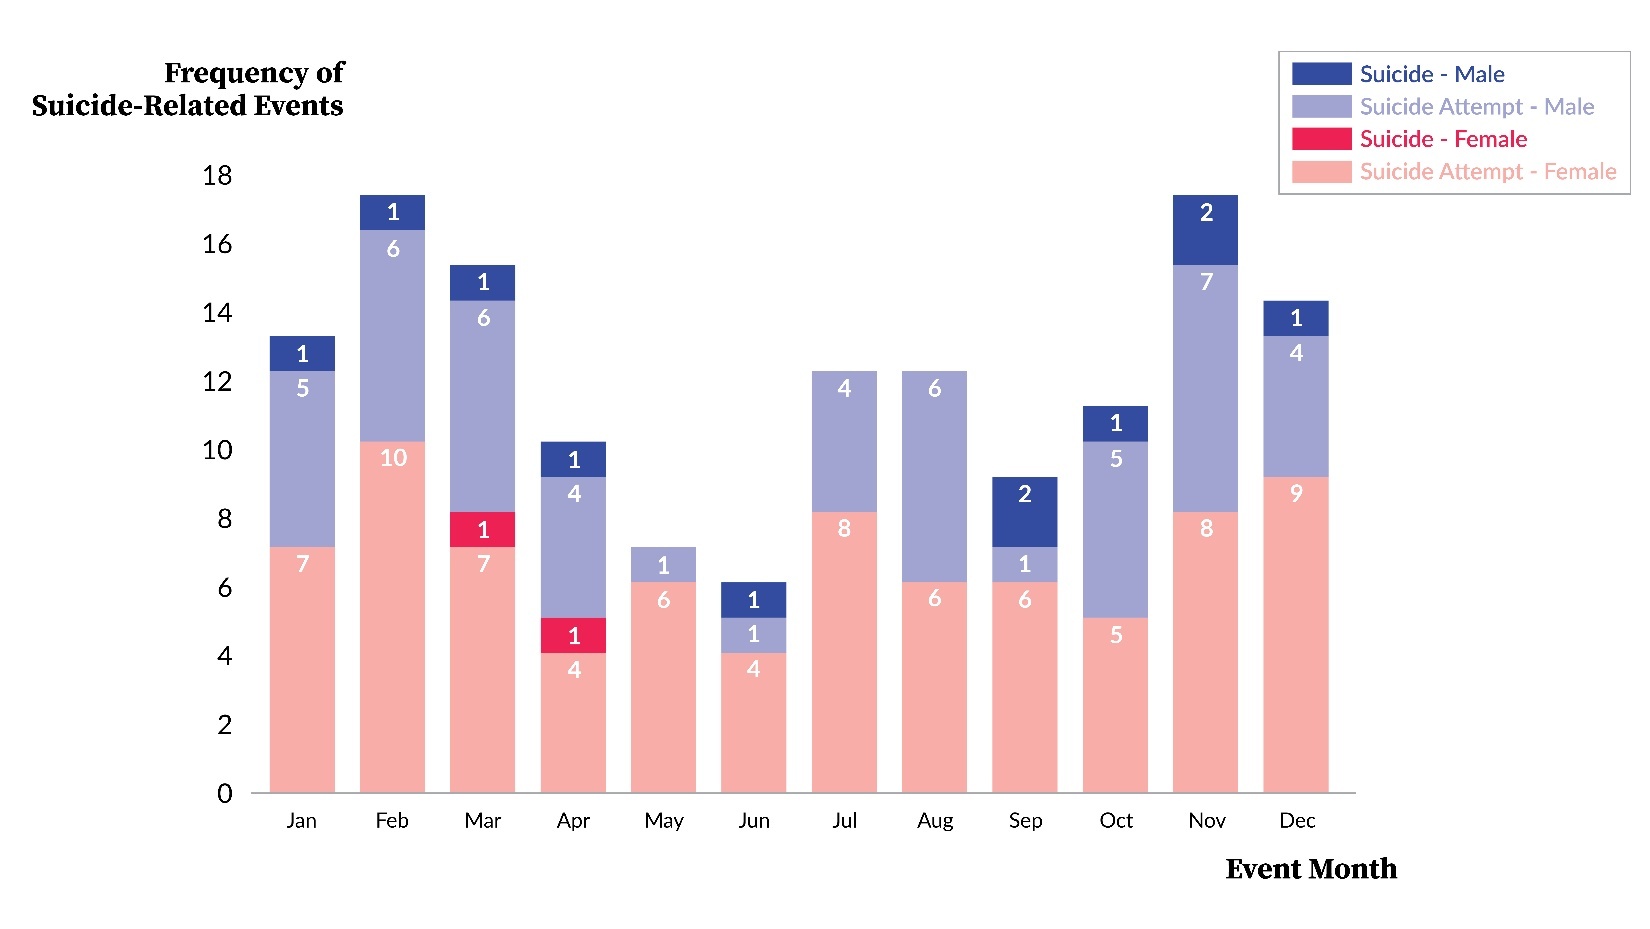
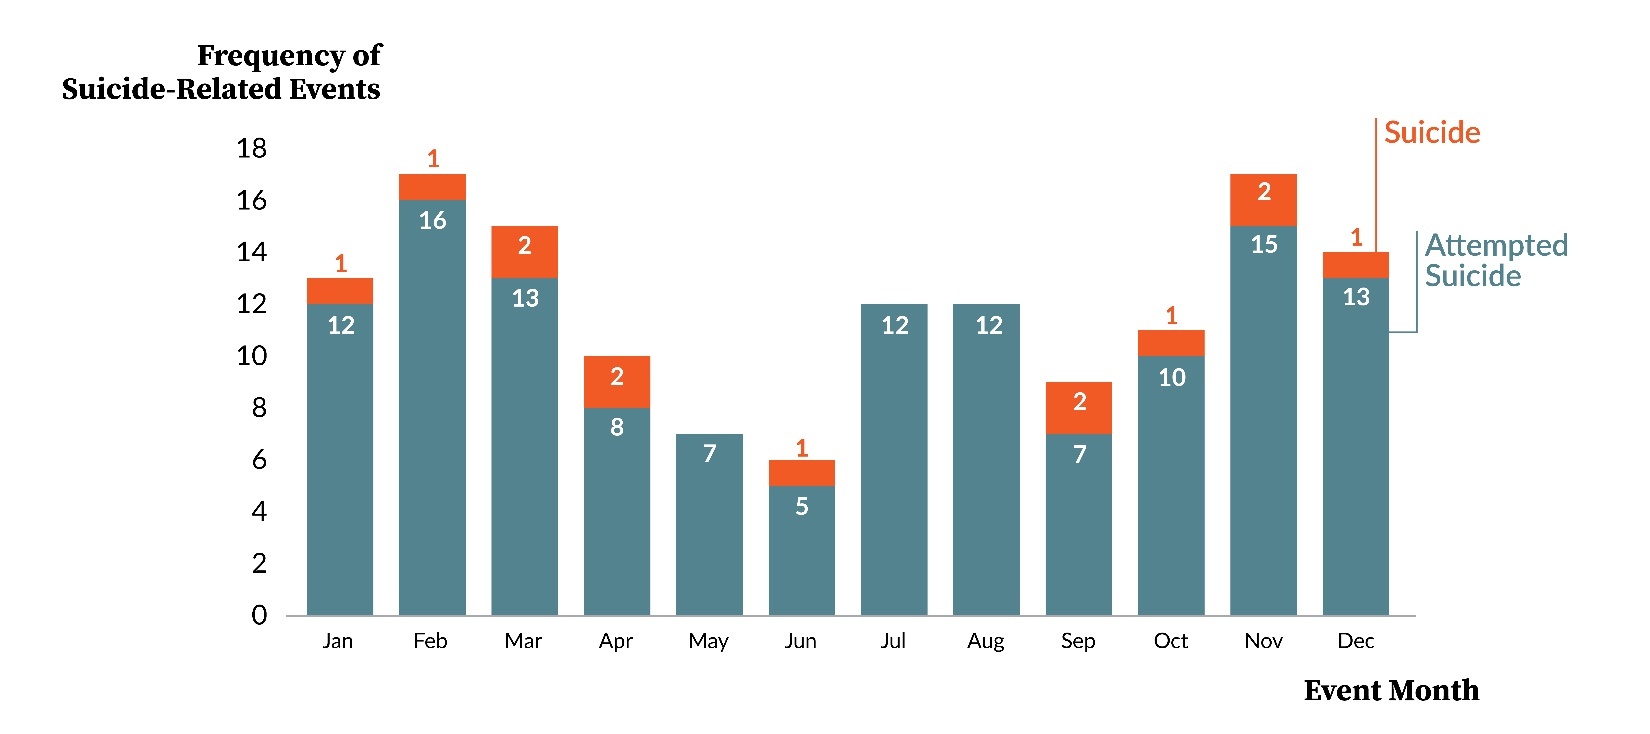
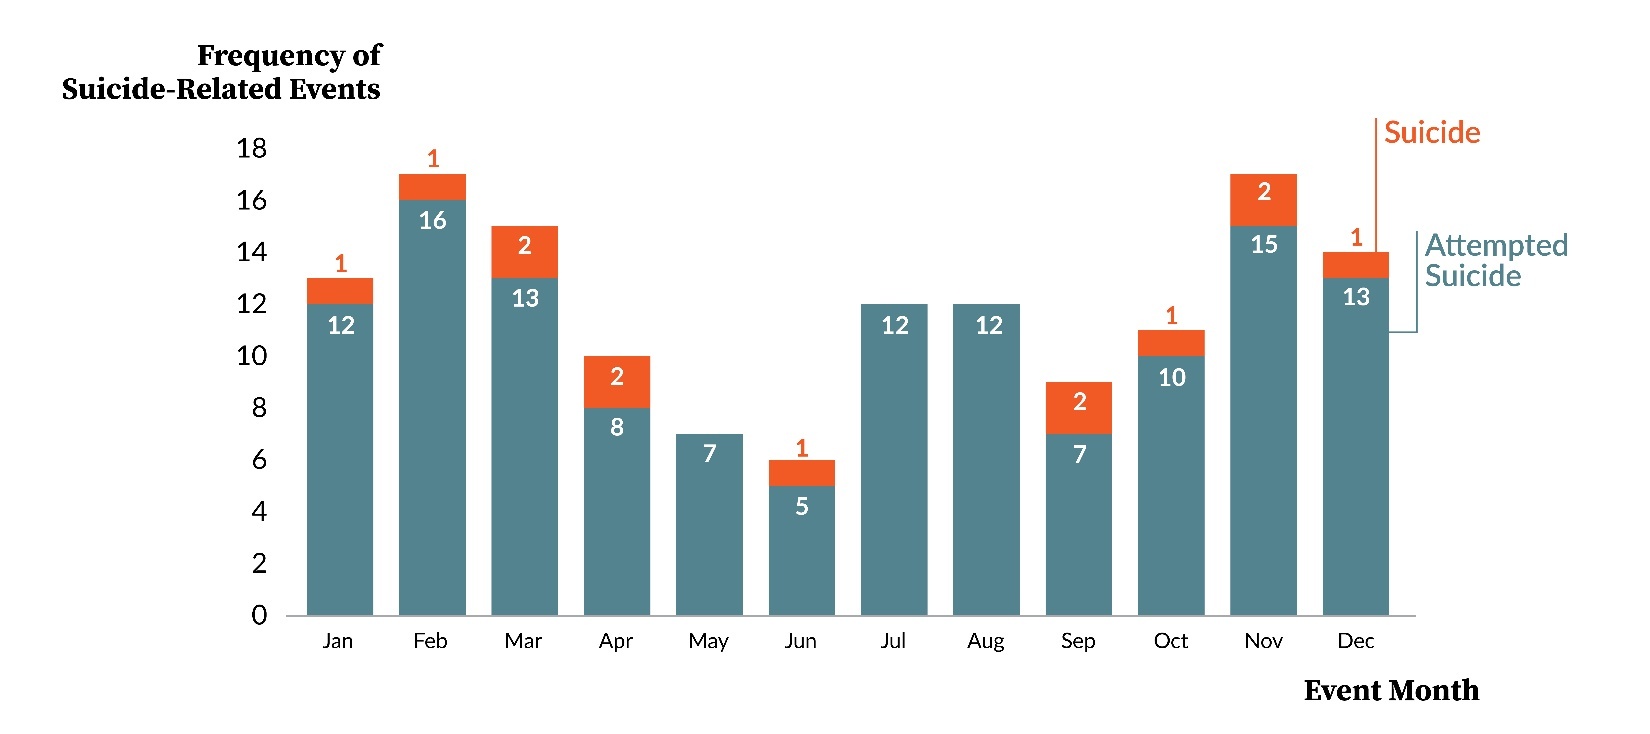
We further explored the distribution of attempted suicides and suicides by event month, as shown in Figure 6. The figure shows that a similar distribution of attempted suicides and suicides occurred during October to March: 61% (79 of 130) of the attempted suicides and 62% (8 of 13) of suicides. The greatest frequency of suicide-related events occurred in February (n=17) and November (n=17), and the least was in June (n=6). The figure also reveals that each of the months during October to March had at least one suicide, while only half of the months during April to September had a suicide. In Appendix 1 we show a visual similar to Figure 6, but with gender as an additional variable. Appendix 1 reveals that the attempted suicides and suicides are largely proportionally similar by category of gender across the 12 months.
Event Day of the Week
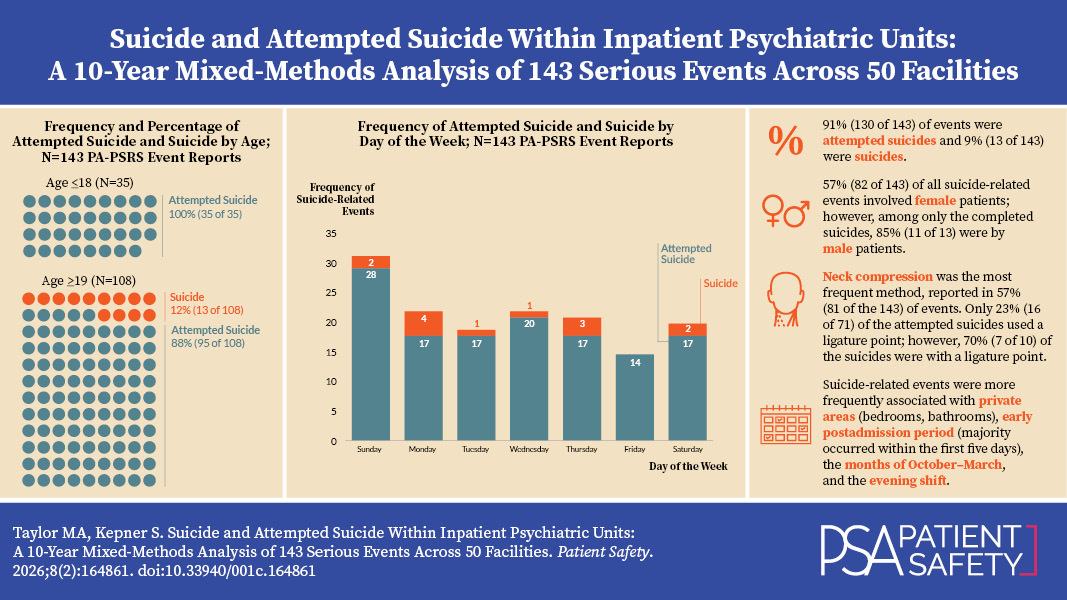
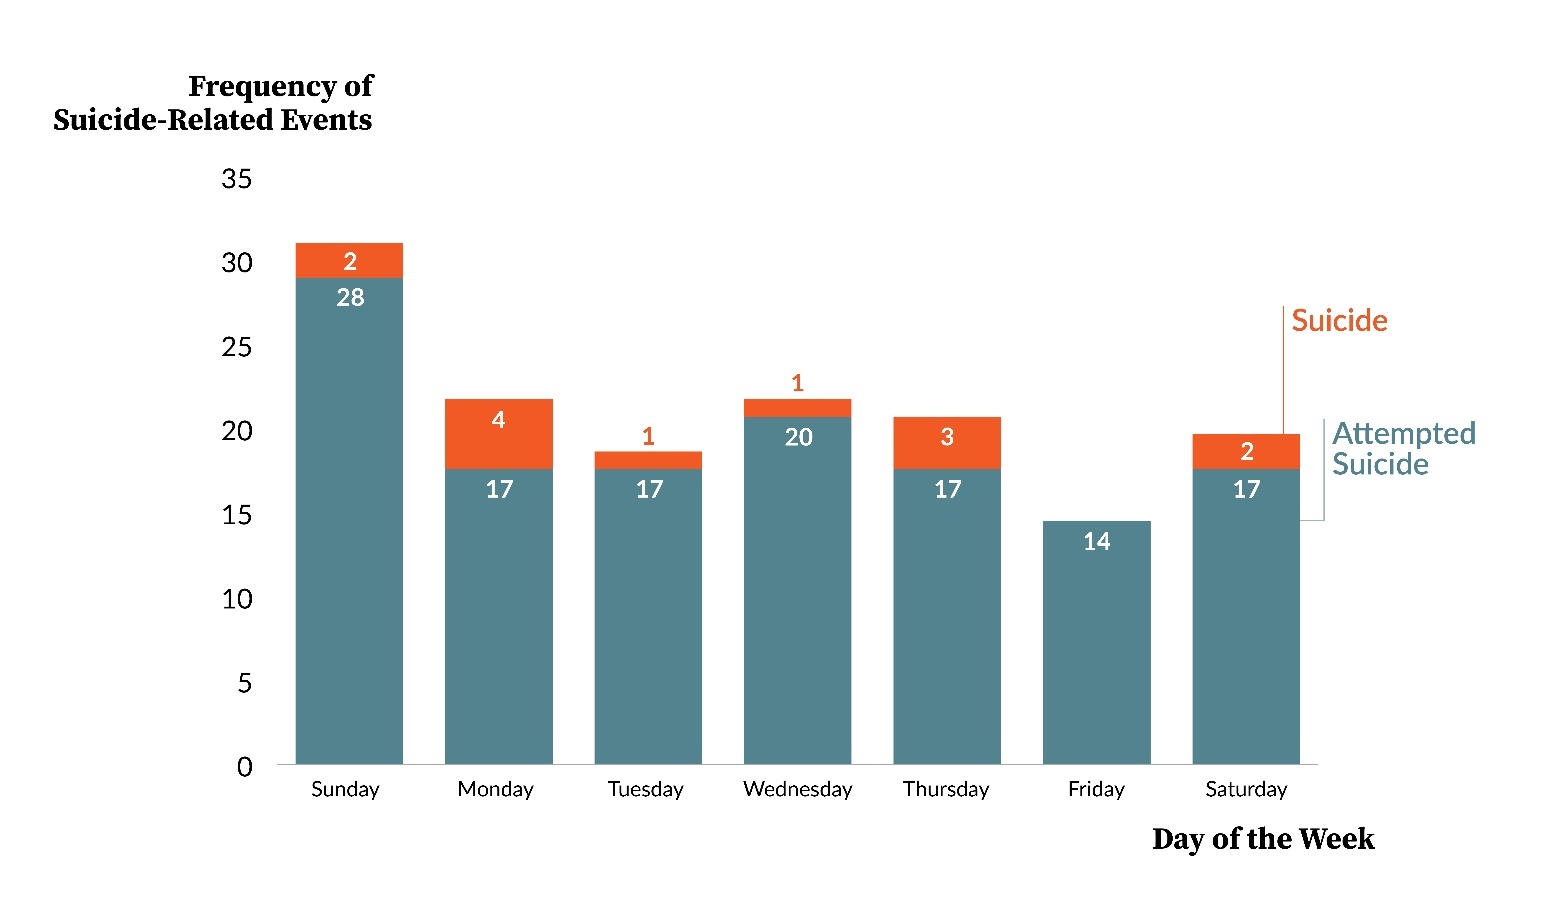
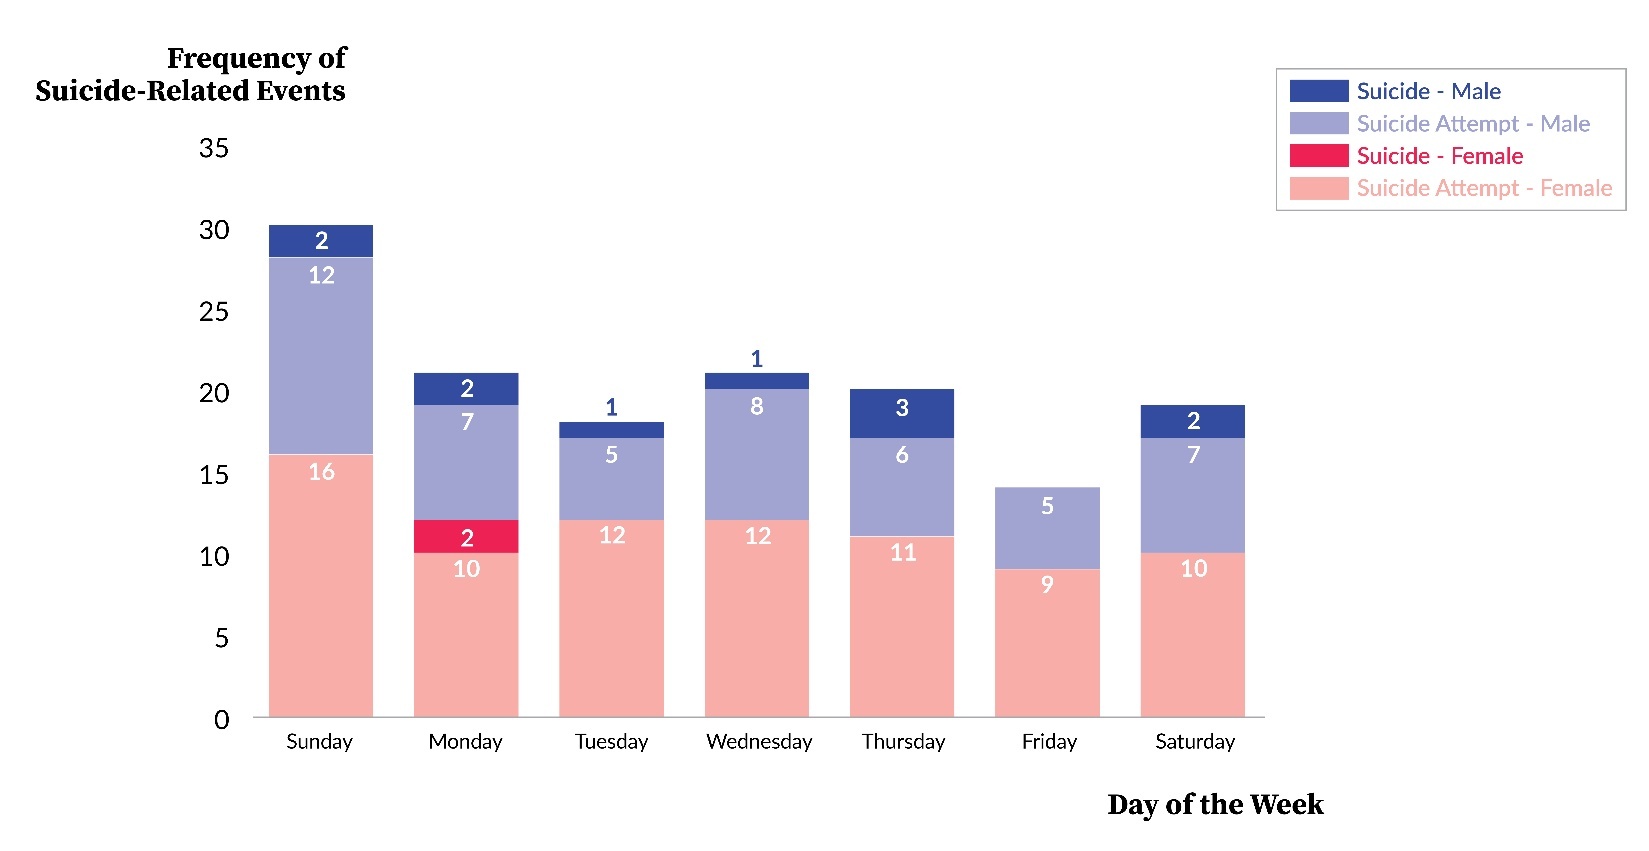
Figure 7 presents the frequency of suicide-related events by day of the week. The frequency of suicide-related events ranged from a high of 30 on Sunday to a low of 14 on Friday. The figure reveals a high frequency of events on Sunday, relative to all other days, with at least 43% more events occurring on Sunday than each of the other days. With a chi-square test, we assessed the distribution of suicide-related events by day of the week, relative to a uniform distribution. The test revealed that the number of suicide-related events, by day of the week, was not significantly different from a uniform distribution, X2(6,143) = 6.94, p=0.327.
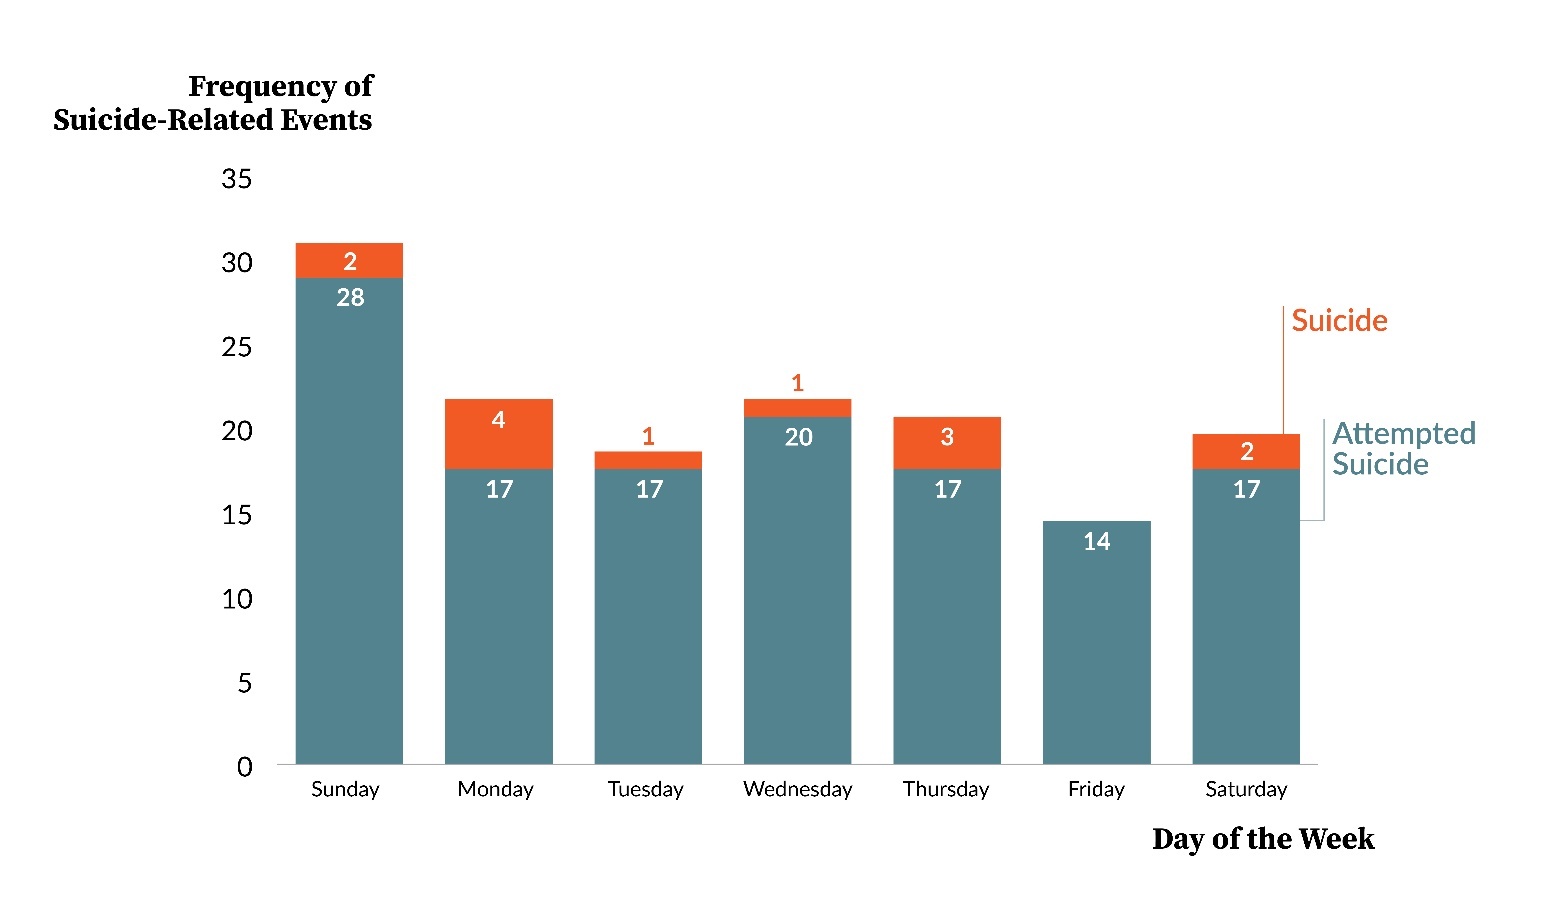
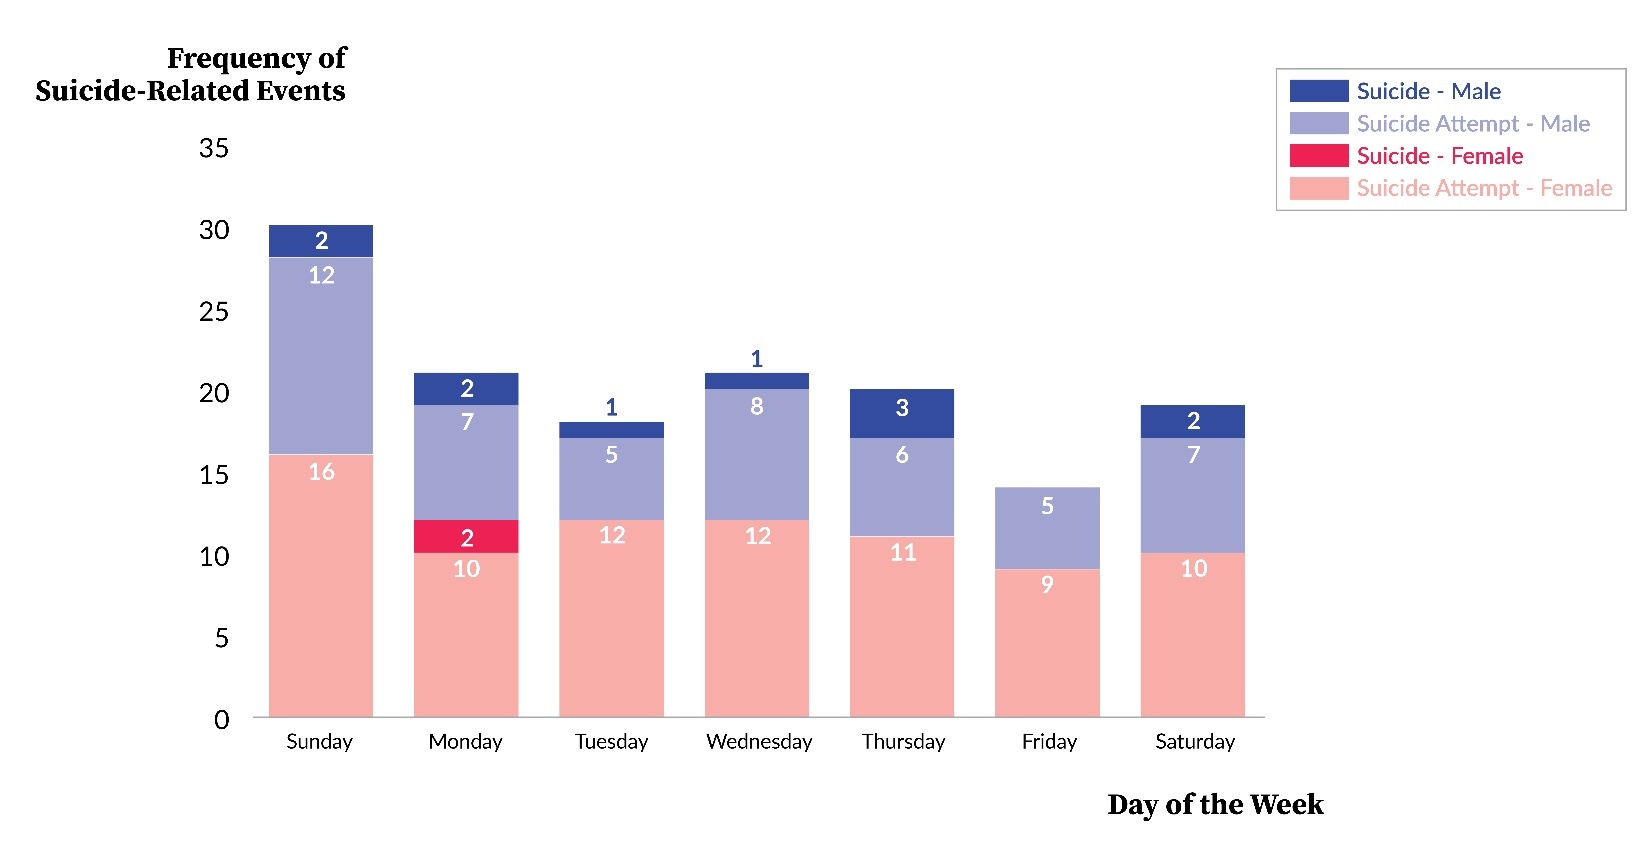
Appendix 2 is similar to Figure 7 but includes gender as a third variable. Appendix 2 shows that each of the suicides by a female (n=2) were on Monday and that the suicides by a male (n=11) were relatively uniformly distributed across each of the seven days. Appendix 2 also reveals that the suicide-related events for both males and females were greatest and least frequent on Sunday and Friday, respectively.
Event Time of Day
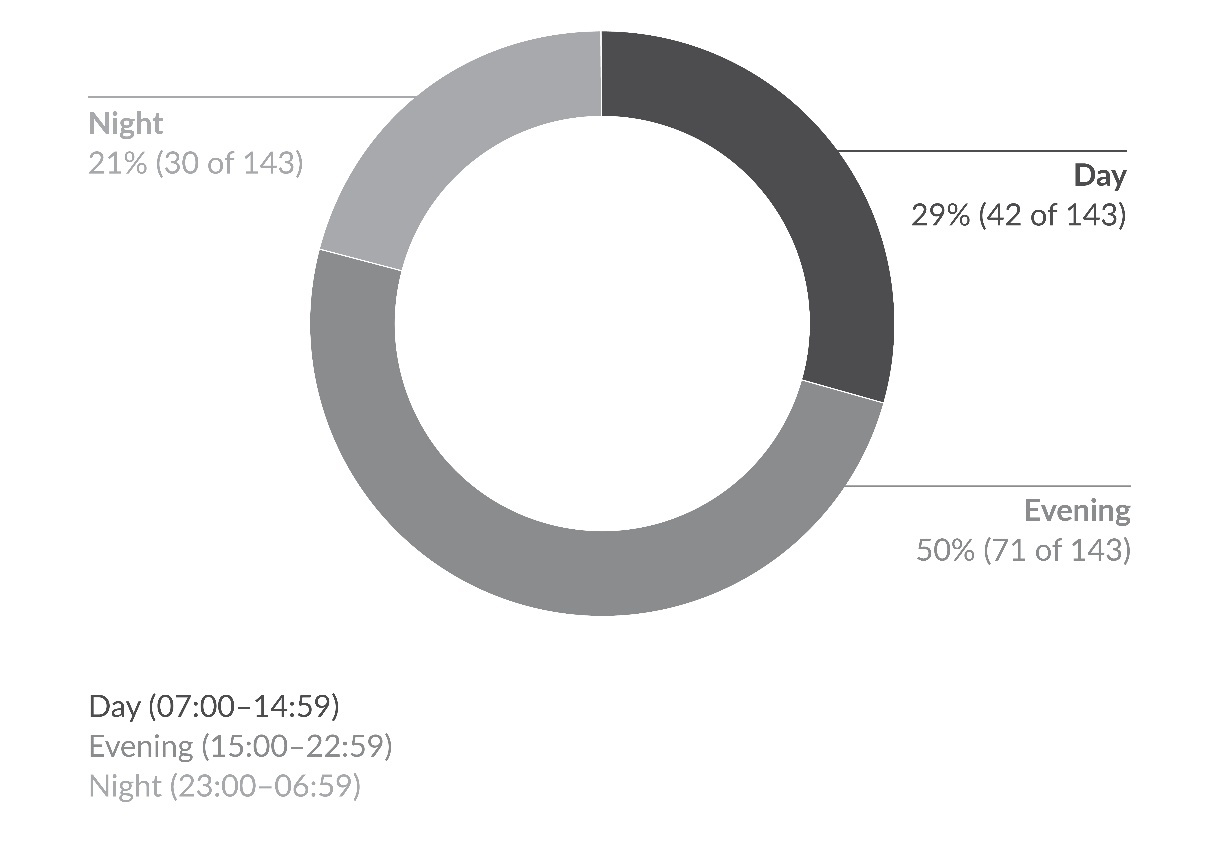
As shown in Figure 8, the timing of suicide-related events was analyzed using eight-hour shift periods: day (07:00–14:59), evening (15:00–22:59), and night (23:00–06:59). Across the three shifts, the greatest percentage of suicide-related events occurred during the evening shift (50%, 71 of 143), which was more than double the night shift (21%, 30 of 143). A chi-square test was used to evaluate whether the frequency of suicide-related events across the three periods of eight-hour shifts was consistent with a uniform distribution. The results indicated a statistically significant deviation from a uniform distribution, X2(2,143) = 18.64, p<0.001. Next, we made multiple pairwise comparisons using a Bonferroni correction to pinpoint the locus of the significant result. There was one significant pairwise comparison, in which the evening shift had a significantly greater frequency of suicide-related events compared to the night shift with respect to a uniform distribution (Bonferroni-corrected p=0.0157).
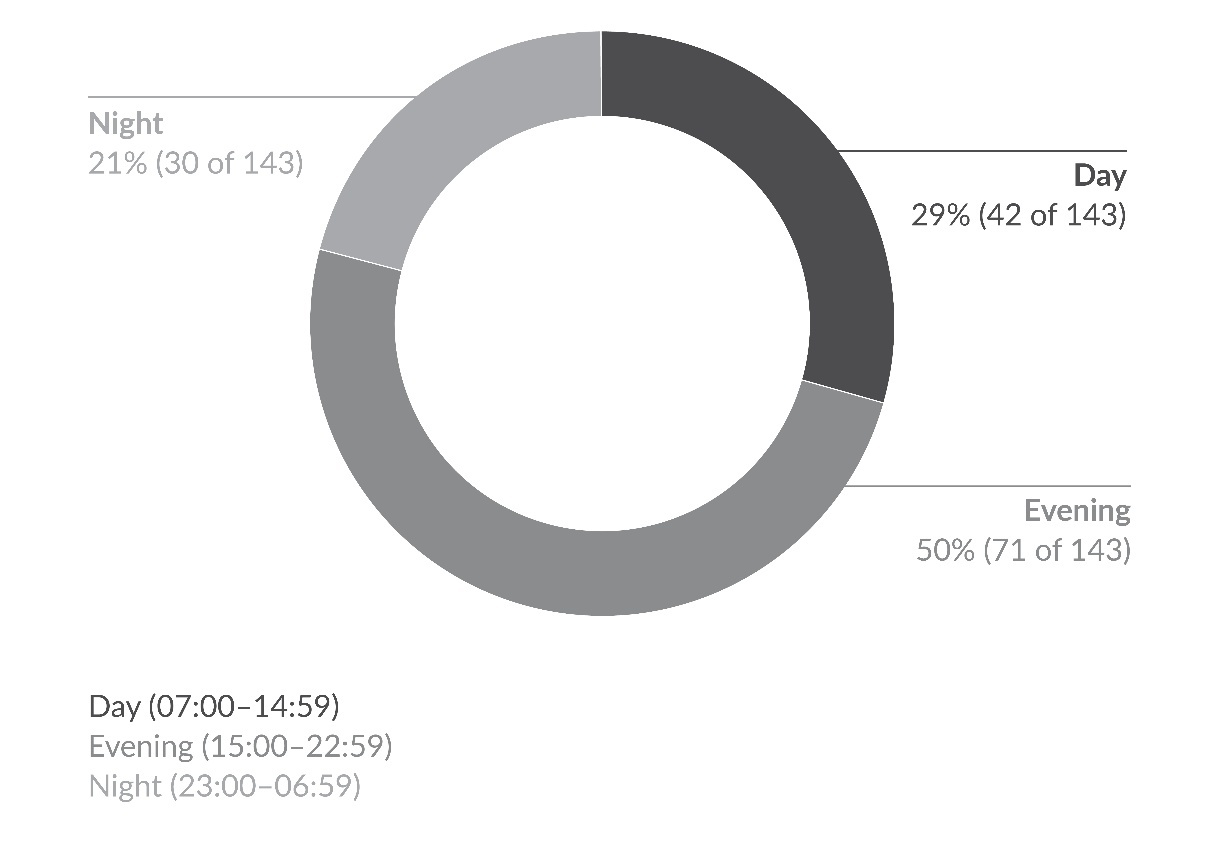
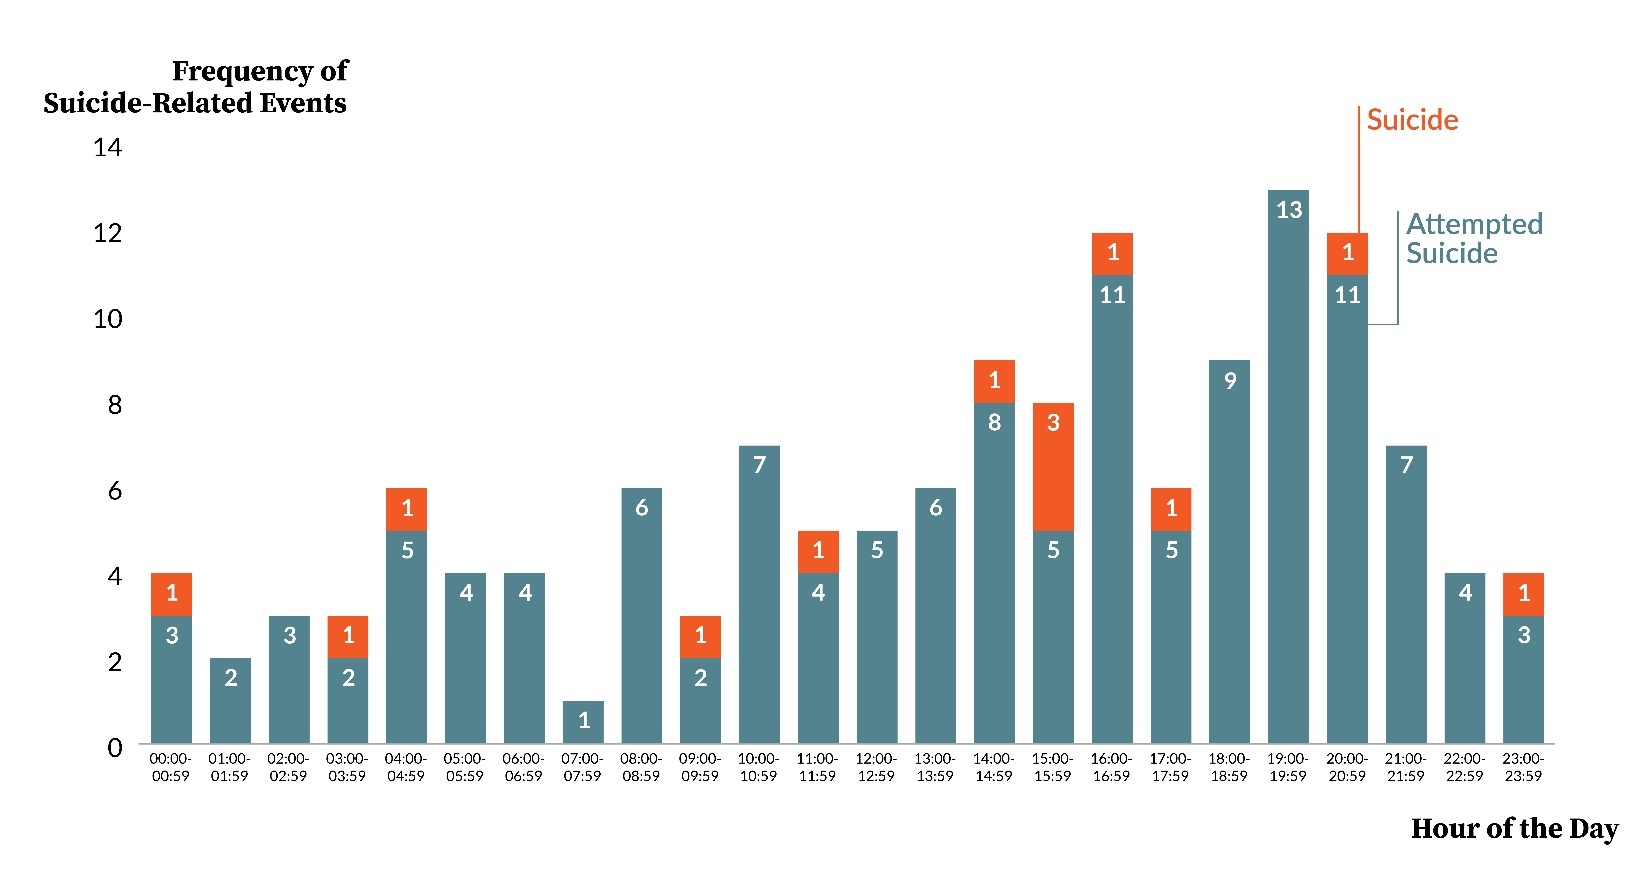
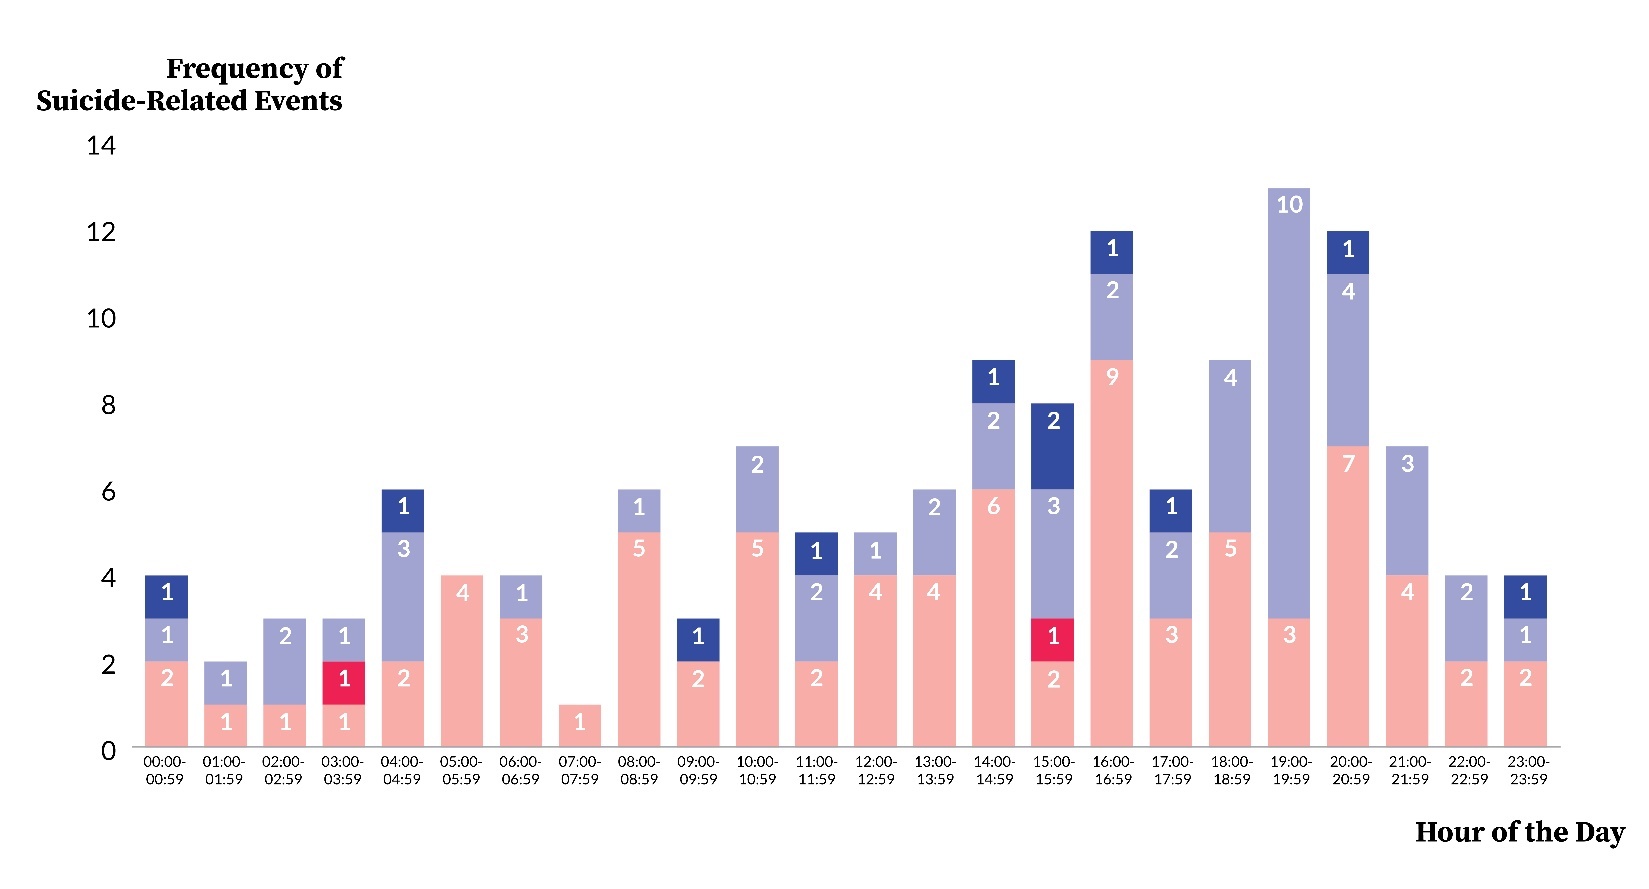
Figure 9 displays the timing of suicide-related events by one-hour periods. The three one-hour periods with the greatest frequency of suicide-related events were all during the evening shift (16:00–16:59, n=12; 19:00–19:59, n=13; 20:00–20:59, n=12). This figure also reveals that nearly half of the suicides (6 of 13) took place during the four-hour period of 14:00–17:59 (end-of-day shift and beginning of evening shift) and that the greatest frequency of suicides occurred following the onset of the evening shift (15:00–15:59, n=3).
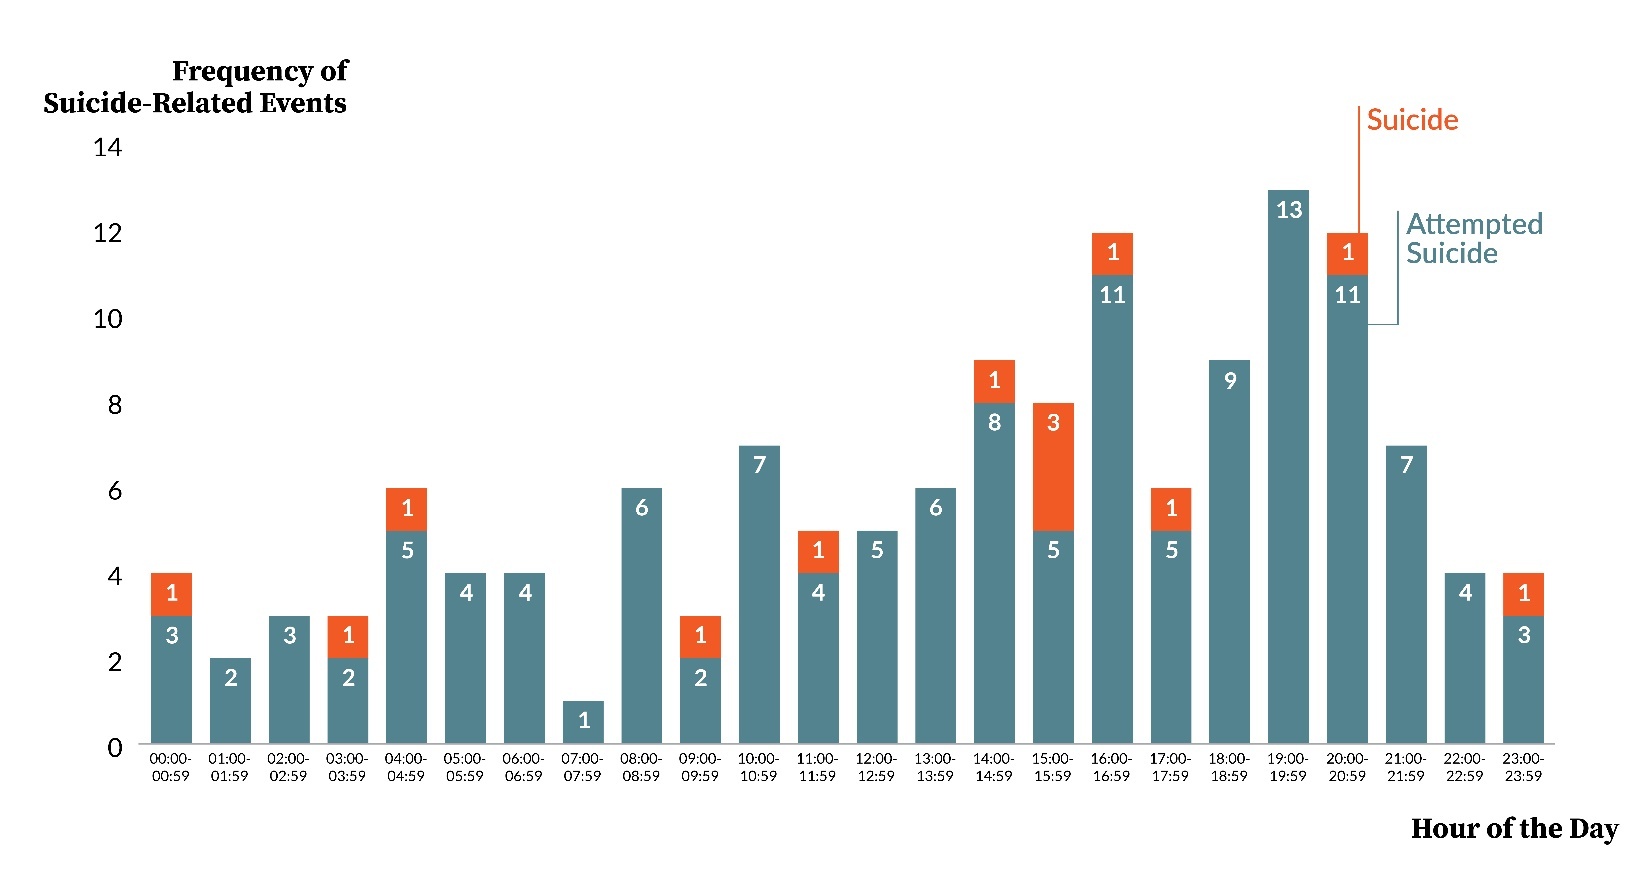
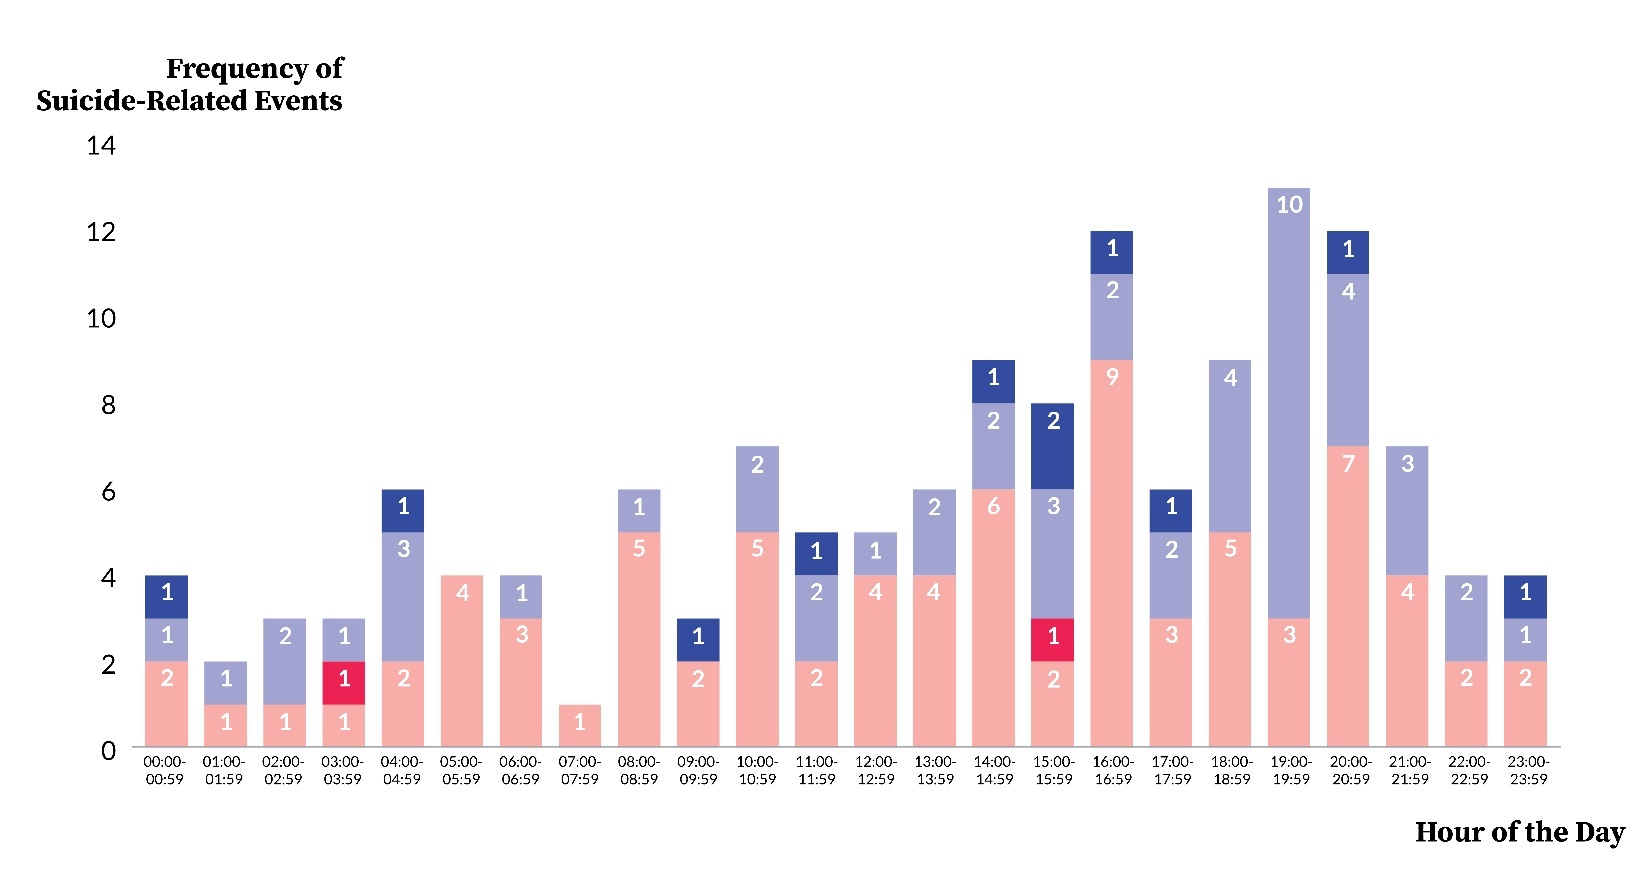
Appendix 3 expands upon Figure 9 by including the gender variable. Appendix 3 shows that the greatest frequency of suicide-related events by females was during 16:00–16:59 (n=9) and the greatest frequency by males was during 19:00–19:59 (n=10). Overall, the distribution of suicide-related events are largely proportionally similar by category of gender across the hours of the day.
Days After Admission
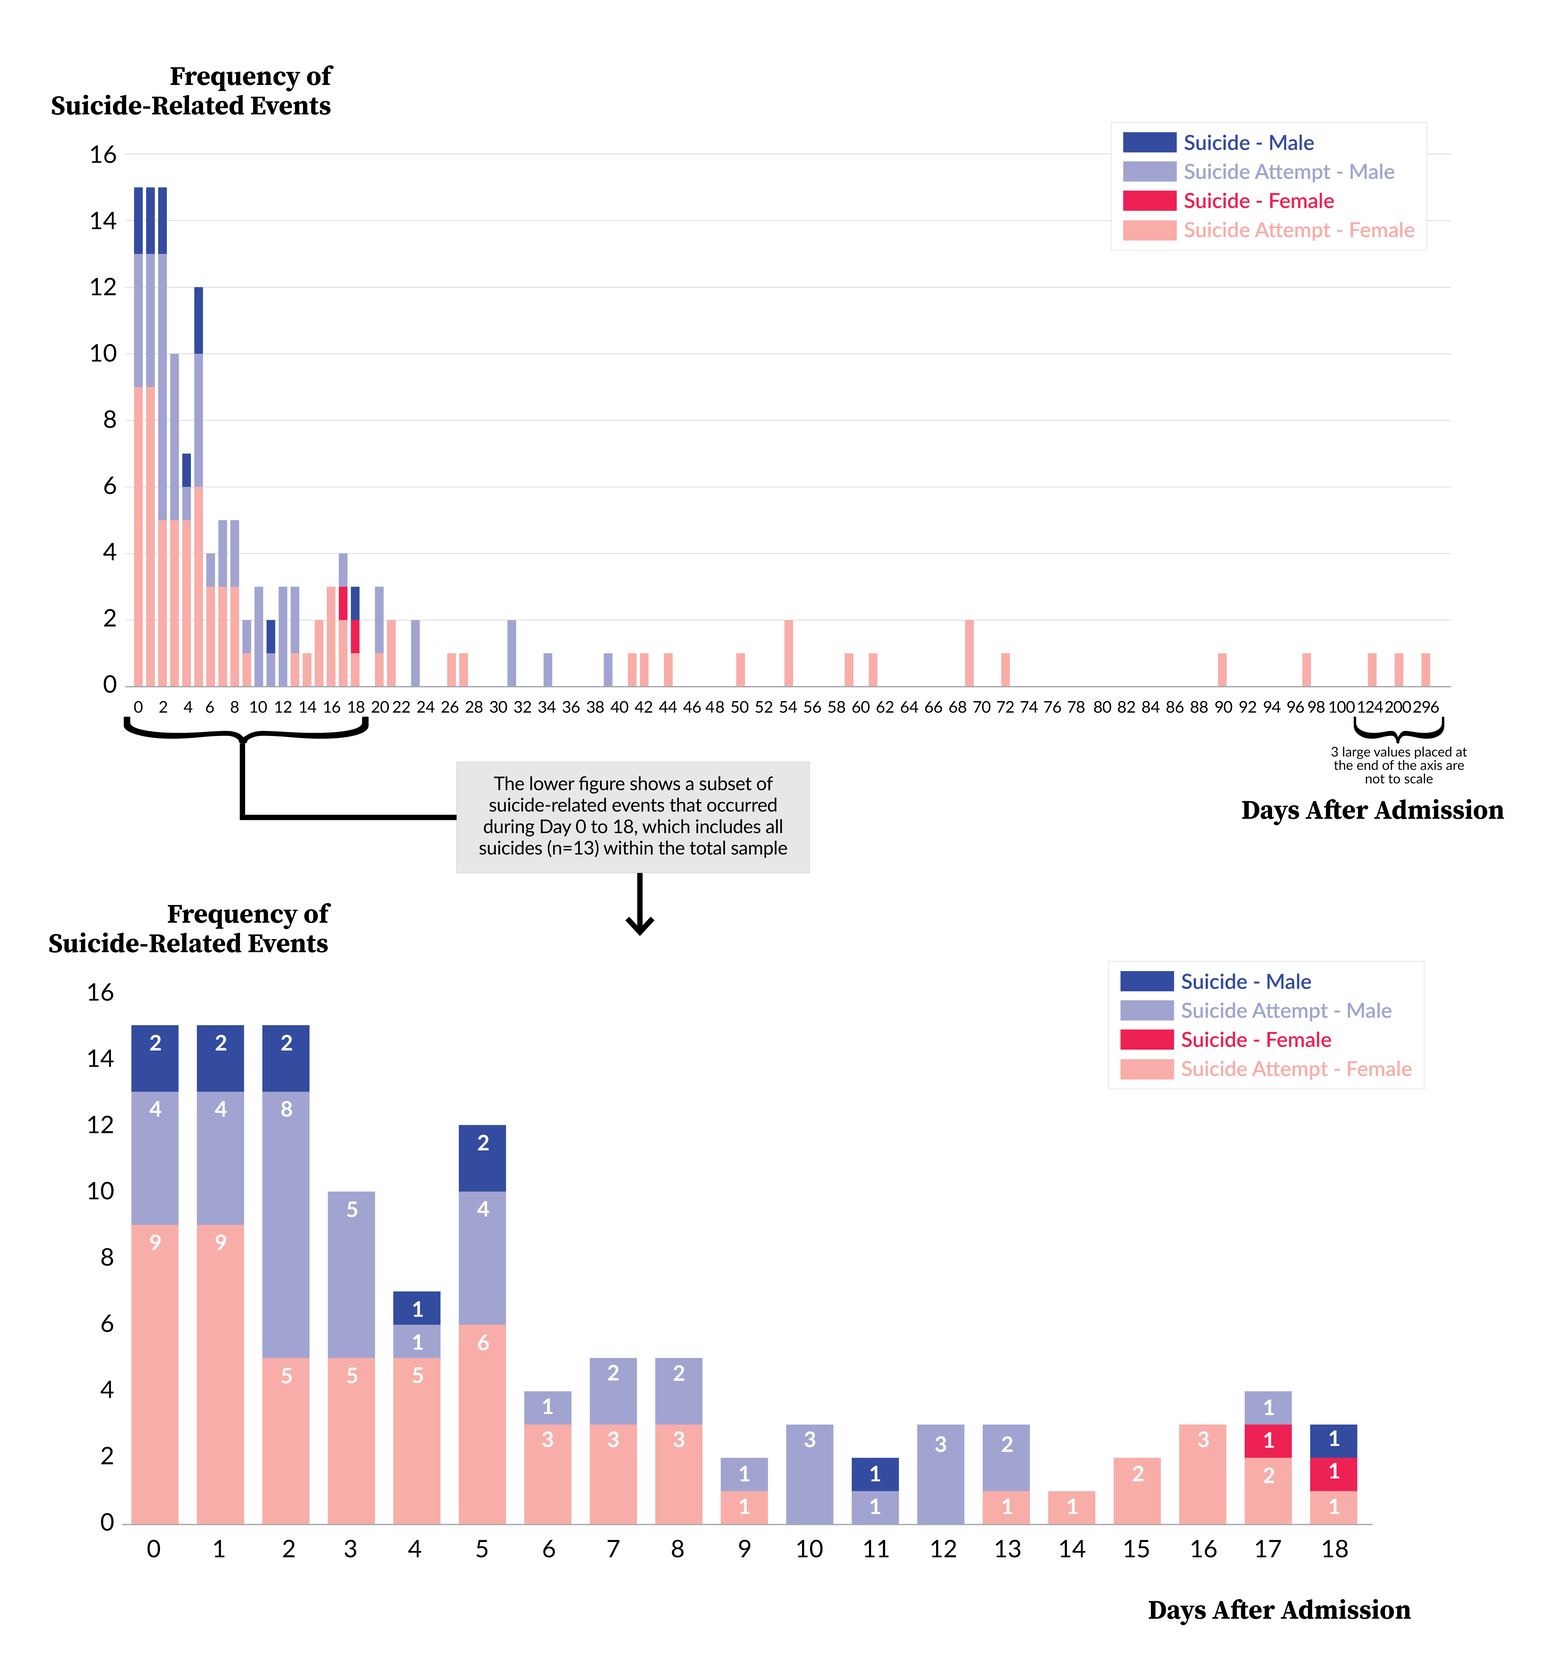
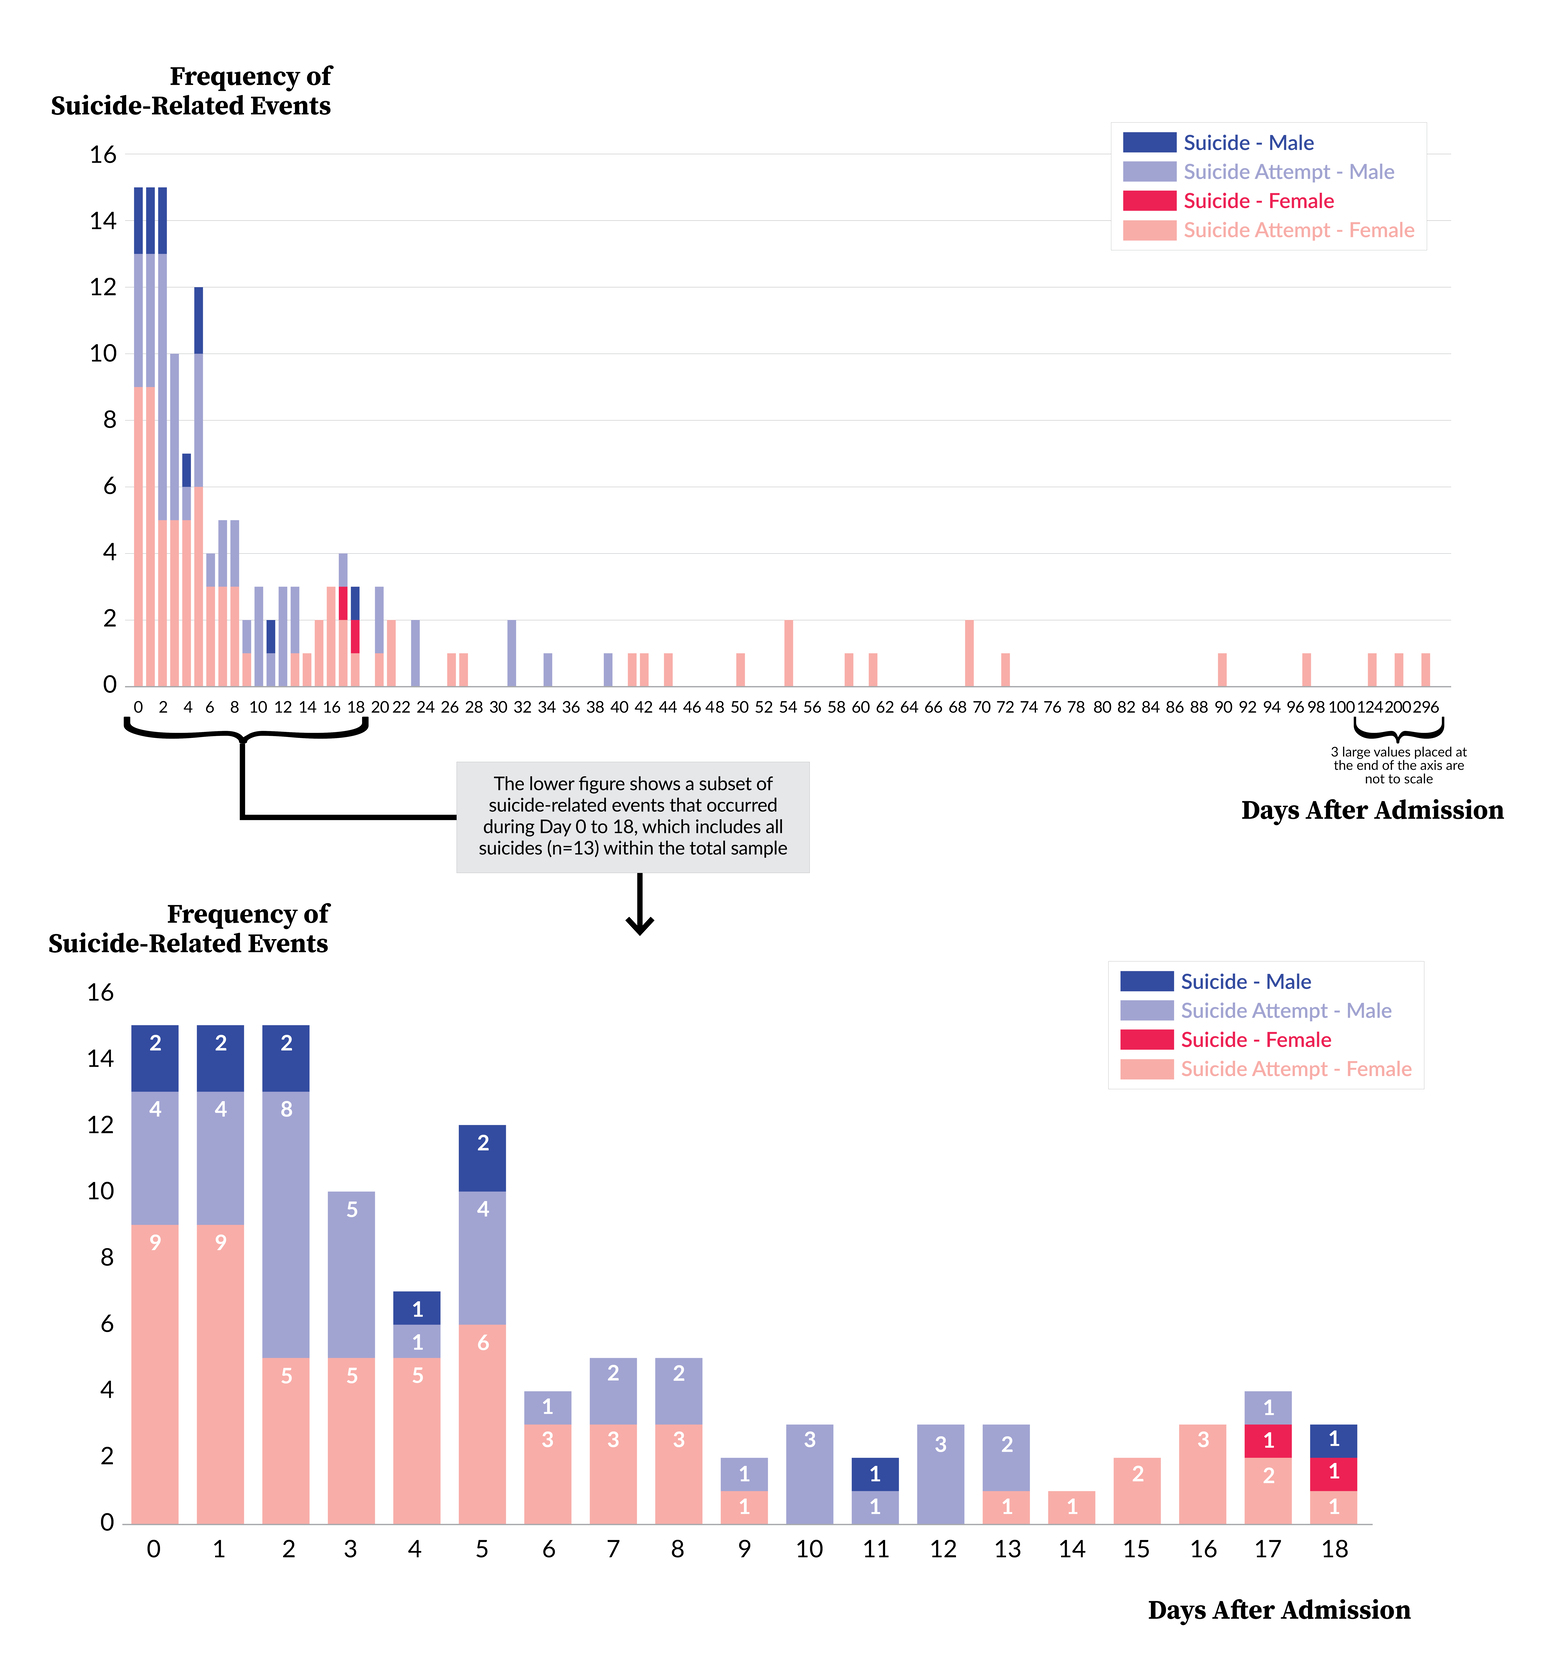
The 143 suicide-related events occurred between Day 0 (same day) and 296 days after admission, as revealed by Figure 10 (average=17, second quartile=2, median=5, and third quartile=16.5). Despite this range, suicide-related events most frequently occurred within the first five days after admission. We also found that 71% (101 of 143) of the attempted suicides and 100% (13 of 13) of the suicides occurred within the first 18 days after admission. Furthermore, Figure 10 shows that 69% (9 of 13) of the suicides occurred within the first 5 days after admission, and each of those were by males. The two suicides by females occurred on Days 17 and 18. As a final observation revealed by Figure 10, all 16 suicide-related events that occurred beyond Day 40 were by females.
Location of Event
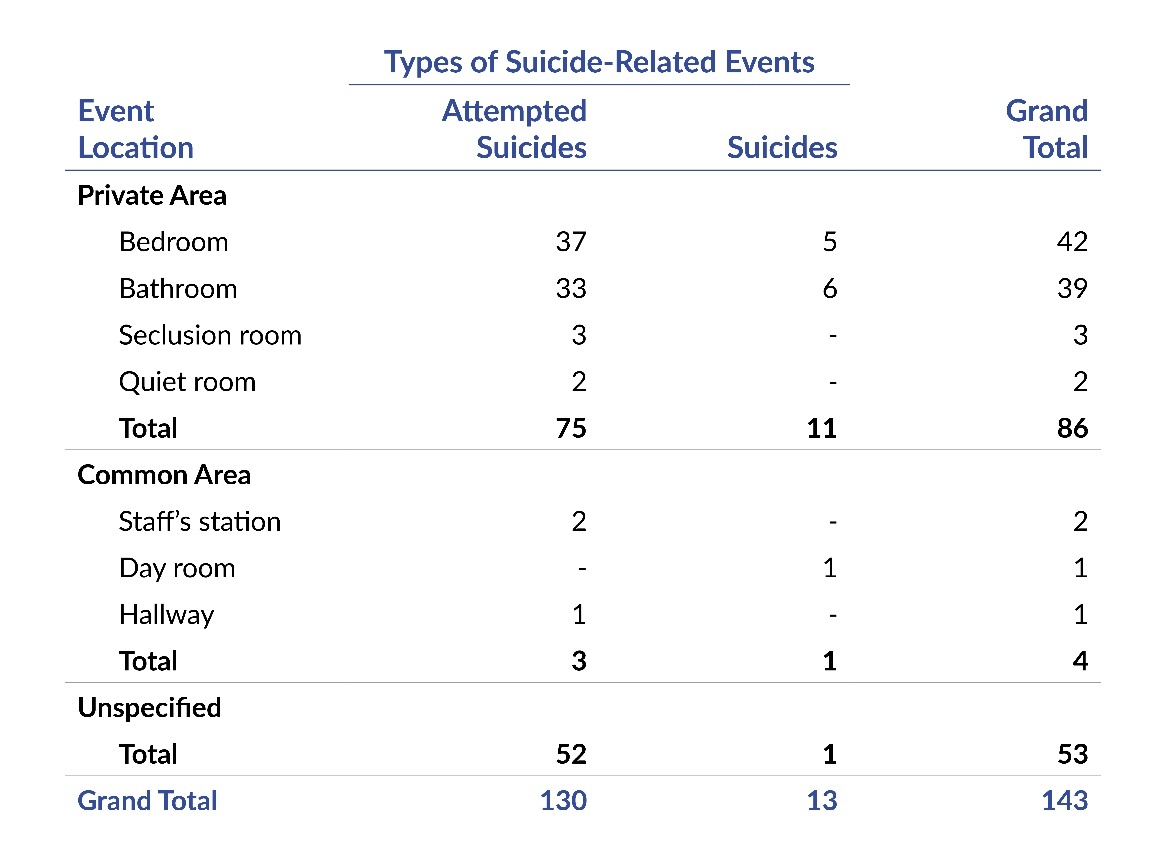
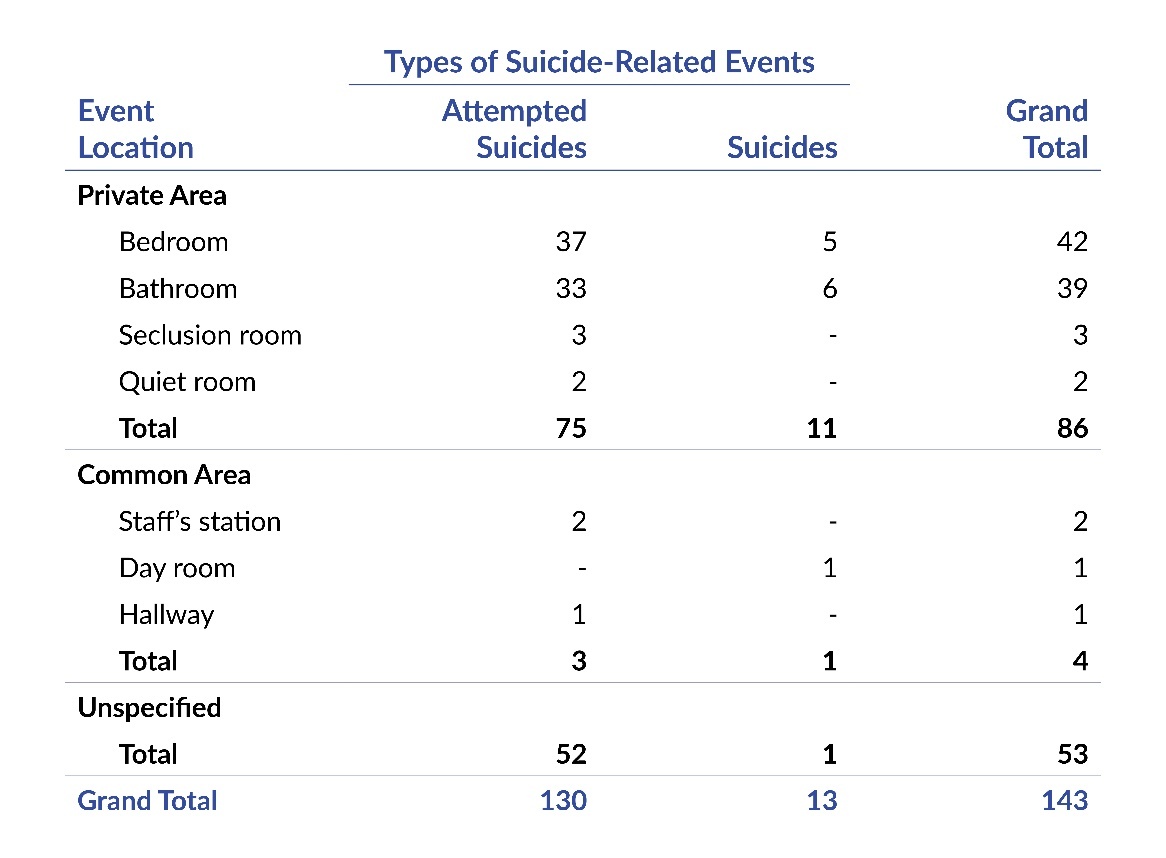
As shown in Table 2, 63% (90 of 143) of suicide-related events specified the location. Among those that specified a location, 96% (86 of 90) occurred in a private area and 4% (4 of 90) took place within a common area. Across all suicide-related events that specified a location, 47% (42 of 90) were in a bedroom and 43% (39 of 90) were within a bathroom. The table also shows that the attempted suicides and suicides were similarly distributed across the bedroom and bathroom locations.
Method
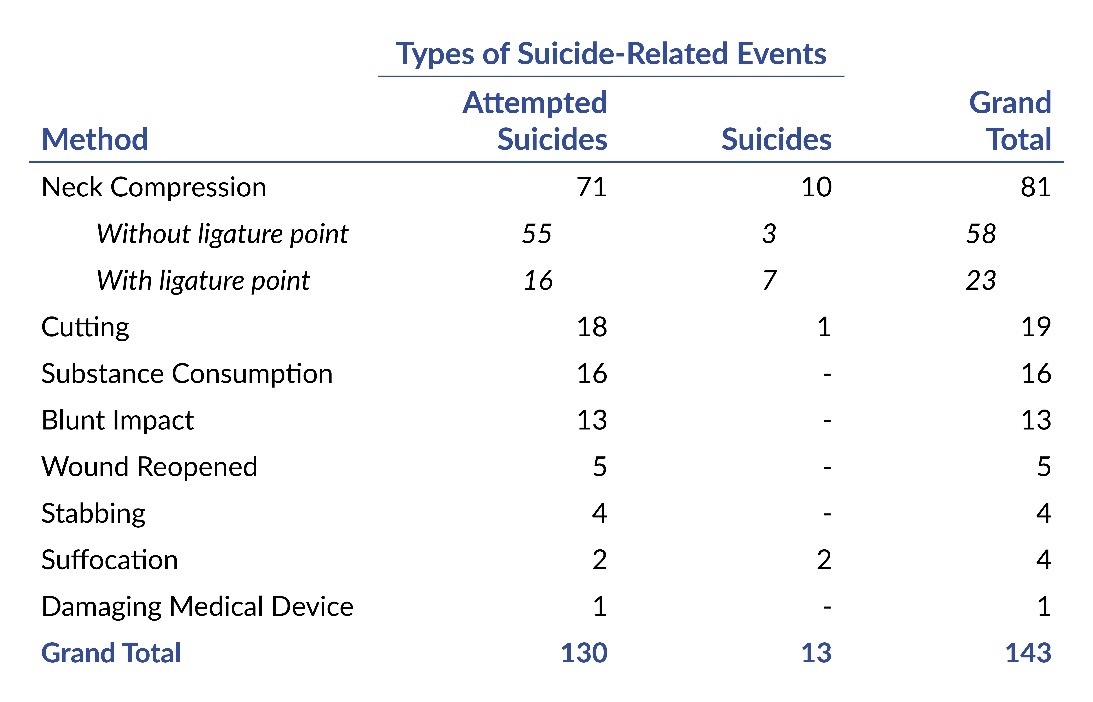
As shown in Table 3, neck compression (57%, 81 of 143) was the method used in a majority of suicide-related events, which was performed with or without a ligature point. Among the neck compressions, only 23% (16 of 71) of the attempted suicides used a ligature point; however, 70% (7 of 10) of the suicides were with a ligature point. Table 3 also reveals that, in addition to neck compression, suicides were also achieved by suffocation (2 of 13) and cutting (1 of 13).
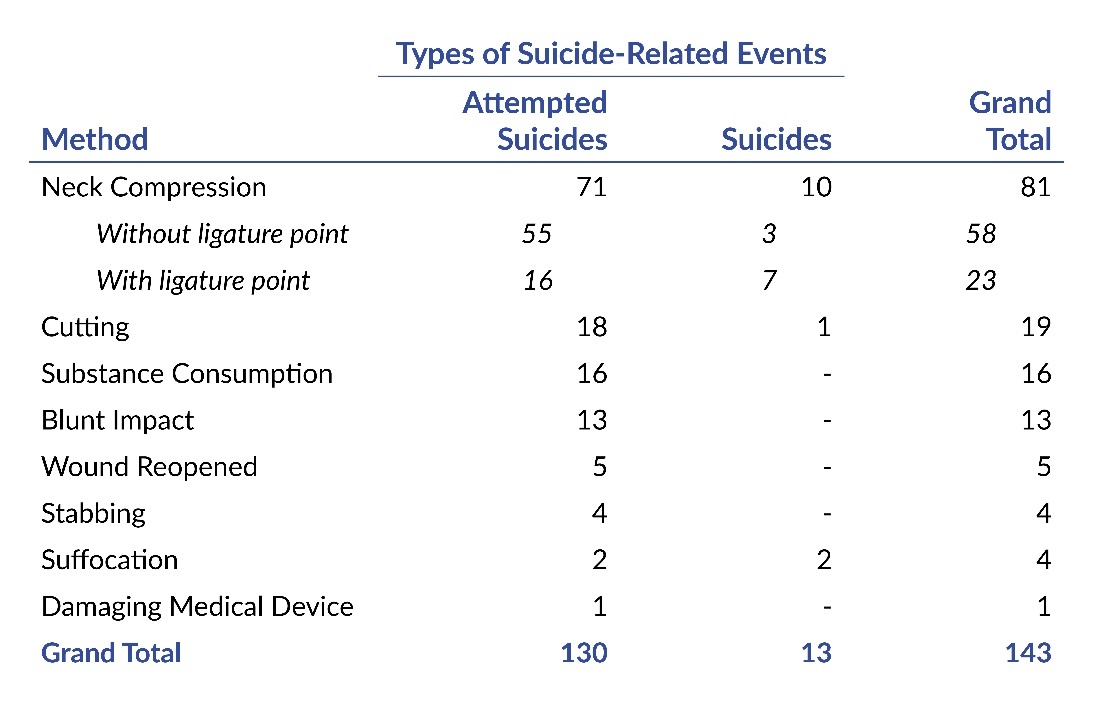
We conducted a two-tailed Fisher’s exact test using the 81 neck compression events and found a significant (p=0.004) association between the use of a ligature point (with or without) and type of suicide-related event (attempted suicide vs. suicide). Suicides involving neck compression occurred significantly more frequently with a ligature point than without a ligature point.
Objects Involved by Method
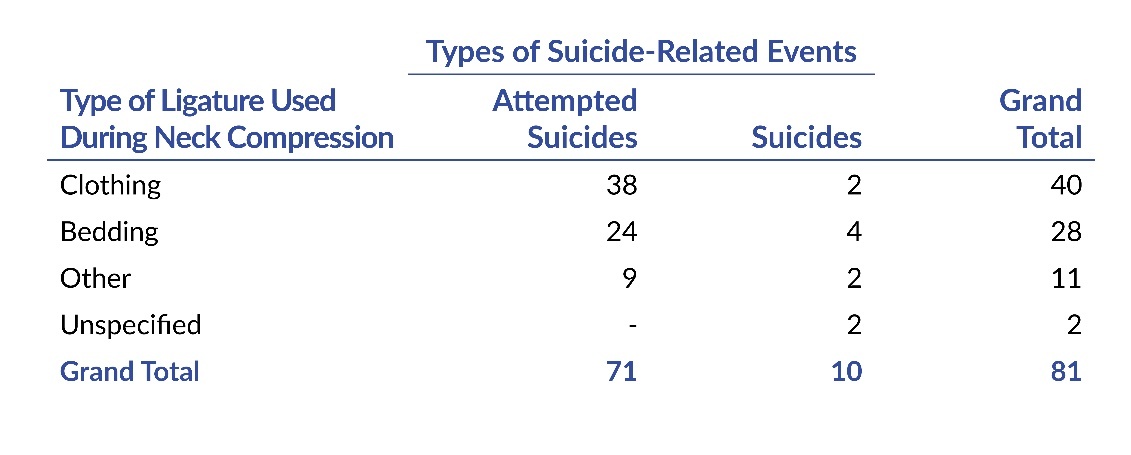
Table 4 demonstrates that ligatures used for neck compression most often involved clothing (49%, 40 of 81) or bedding (35%, 28 of 81). The most frequently used types of clothing were pants, shirts, shoestrings, or gowns. Among the suicide-related events involving bedding as a ligature, almost all involved a bedsheet, as opposed to a pillowcase or blanket. The objects within the “Other” category of ligature included a string, towel, cord to video game system, and shower curtain.
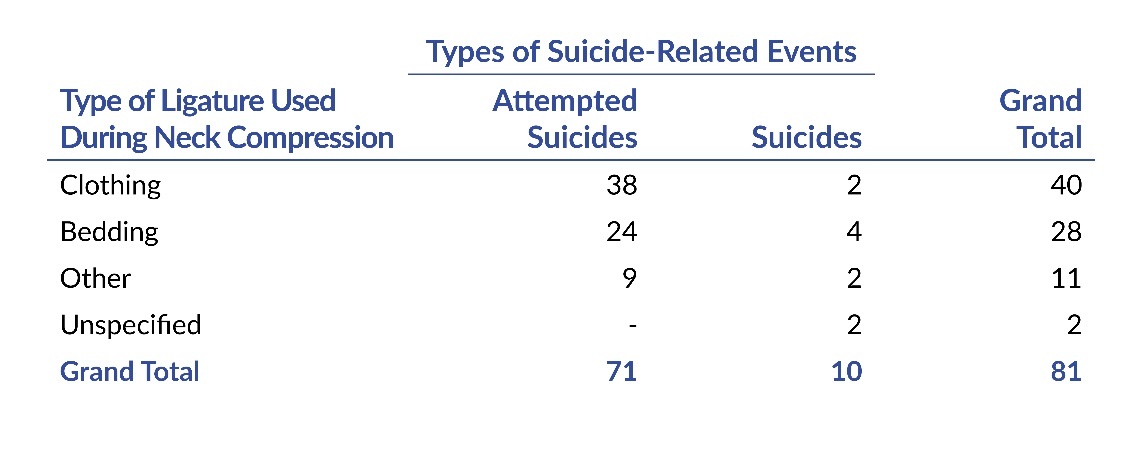
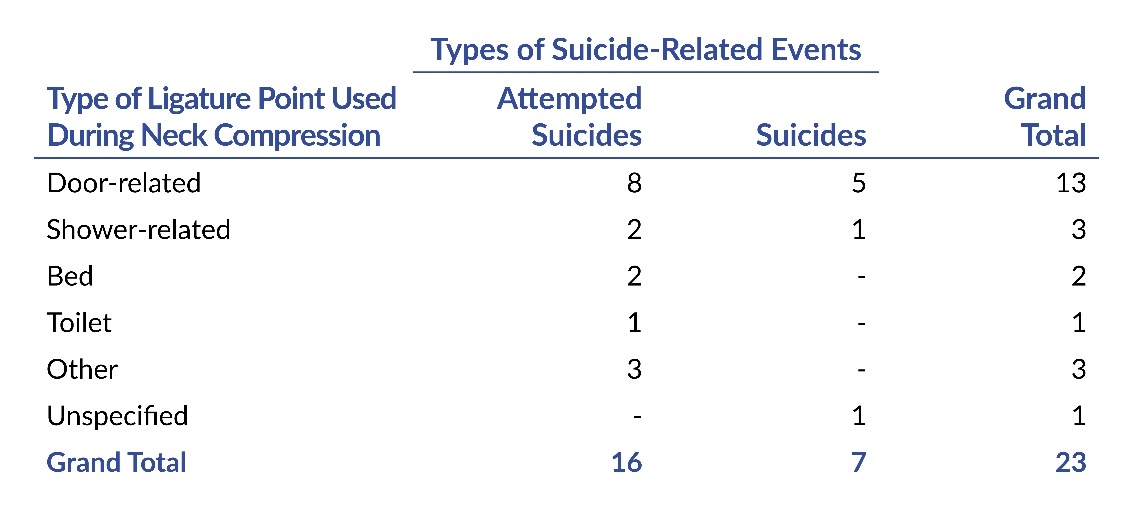
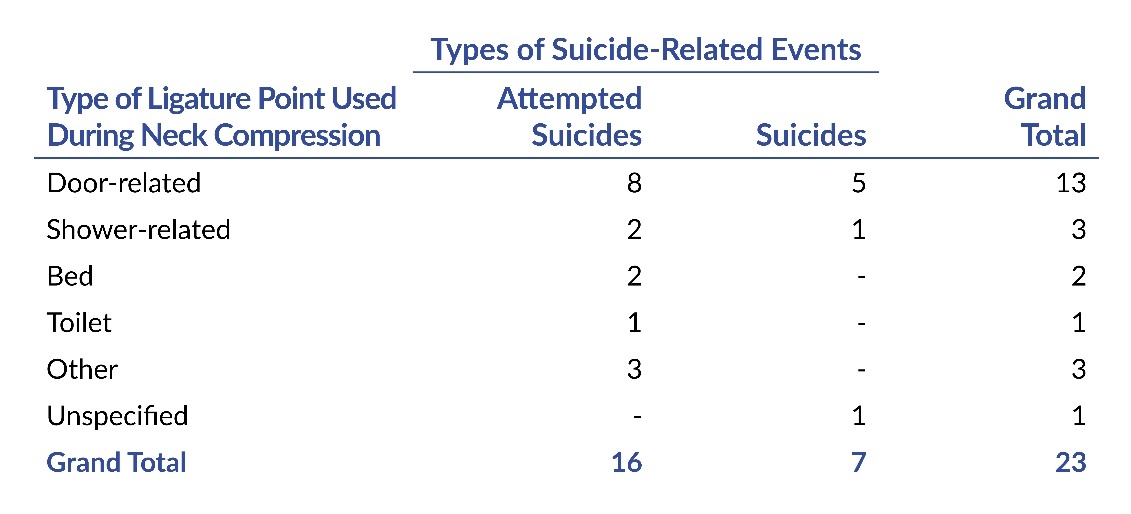
Table 5 shows that across all suicide-related events that involved use of a ligature point during neck compression, a door-related object was the ligature point in 57% (13 of 23) of the events and primarily involved the door/jamb or hinge. Among the shower-related events, the ligature point was the mixing valve or shower rod. Within the “Other” category, the ligature points were a handrail, window, or wheelchair. Table 5 also shows that among all of the suicides that involved a ligature point, and where the report specified the ligature point, the patients used a door-related or shower-related ligature point.
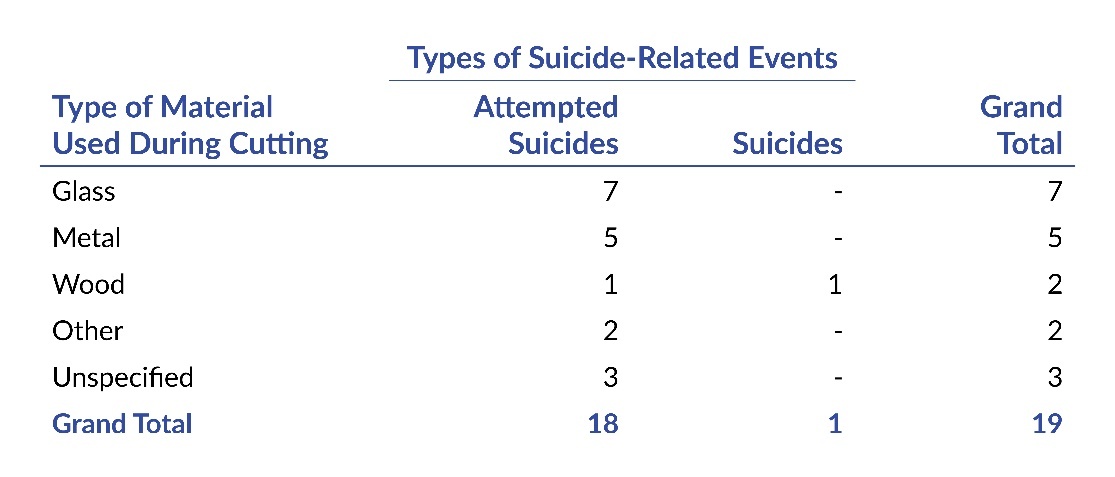
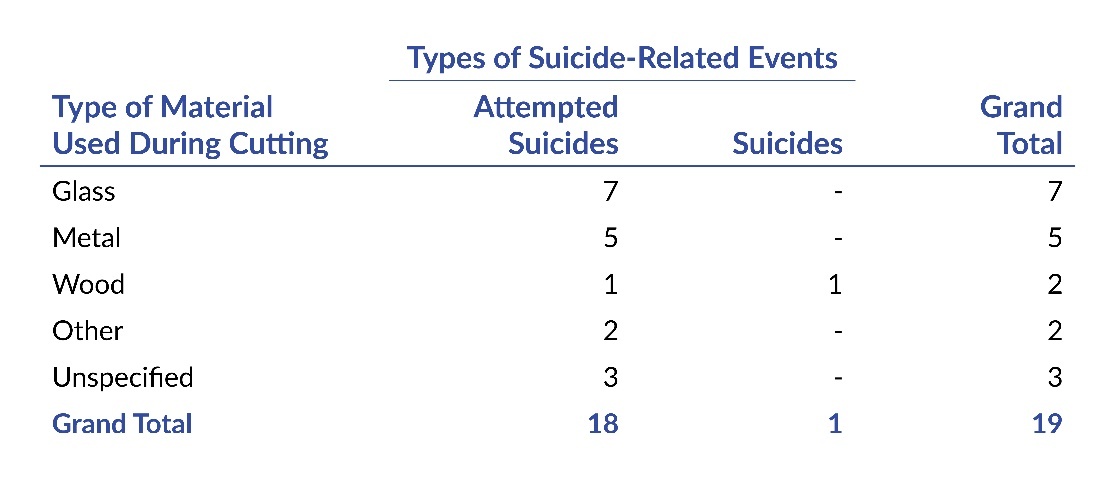
Across all suicide-related events, 13% (19 of 143) were performed by cutting and involved three primary categories of material, as shown in Table 6. Glass and metal were the most frequent materials; however, only wood was involved in suicide by cutting. According to the reports that described the cutting suicide-related events, the materials were sourced from a range of objects, such as light bulb, computer monitor, eyeglasses, heater, pencil, picture frame, plate, razor blade, and wristband.
Discussion
This study makes a notable contribution to the field of patient safety and mental health by exploring numerous conditions in which patients within U.S.-based psychiatric inpatient units are both attempting suicide and completing suicide. Much of the prior research included only attempted suicides10 or only suicides,3–21 as opposed to both attempted suicides and suicides,28,29 which were 91% and 9% of our sample, respectively. The results show that the frequency of attempted suicides and suicides are not uniformly associated with all of the variables targeted in this study; therefore, the stratification of attempted suicides and suicides suggests that certain conditions are associated with greater lethality.
Our study revealed a sharp contrast in the distribution of attempted suicides and suicides by gender. A large majority of suicides were by males (85%); however, females were associated with a majority (62%) of the attempted suicides. This male suicide finding is consistent with much of the prior literature.4,6,15–17,20,33 Interestingly, we were able to identify only one study that explored the relation between attempted suicides and gender; nevertheless, our finding was consistent with that study.10
Similar to prior studies of psychiatric inpatients,10,20 the age range of suicide-related events extended from preteen/teen to beyond 75 years. Our finding that the patients’ average age was 35 years is aligned with the previous studies.6,10 When narrowing the analysis to only suicides, our study revealed that the events occurred among an age range of 22–86 years, which is different from prior studies that reported suicides among inpatient teenagers.7,17,20
Within inpatient psychiatric units, the month/season of suicide-related events is a relatively understudied topic, as we were able to identify only two studies within the last 25 years.10,15 Unlike other studies that reported nonsignificant findings,10,15 our study detected a significantly greater frequency of suicide-related events during October to March, which corresponds with a six-month period of least sunlight per day in Pennsylvania. This finding is in contrast with those from more general studies that report a peak of suicide occurrence during spring and a low during winter.18,34
In our study, like a previous study,3 suicide-related events occurred most frequently on Sunday. Conversely, another study15 reported that the greatest frequency of suicides occurred on Wednesday and Thursday, and a literature review33 found that suicides were frequently reported on Monday and Saturday. This collection of findings across our study and previous studies suggest that the day of the week is not a consistent risk factor across various settings and populations.
The evening shift (15:00–22:59) in our study was associated with a significantly greater frequency of suicide-related events than the night shift (23:00–06:59), which had the least frequency of events. One study10 reported suicide events by the hour and showed a pattern of occurrence very similar to our study, with the greatest frequencies clustered in the period of 16:00–20:59 (during evening shift). Unfortunately, it is difficult to make comparisons with much of the other research due to differences in groupings of hours and lack of reporting frequencies by the hour. Nevertheless, two studies3,8 reported a very low frequency of events during the early morning hours, which is consistent with our results. Another study had contrasting results by reporting the least frequency during 16:00–20:59 and the greatest frequency during 21:00–06:59.5 A literature review reported that the frequency of suicide varied by time of day, but evening and night times were commonly associated with suicides.33
Consistent with previous studies and a systematic literature review,3,16,21,33 our results showed that suicide-related events within inpatient psychiatric units occurred most frequently within a short period following admission (50% occurred during Day 0 to Day 5). Among only suicide events, 69% occurred within a week after admission, which is much higher than prior studies that reported a range of 19% to 41% during comparable time periods.3,15–17,21 Also aligned with a prior study,3 suicide-related events occurred across a broad range from zero to 296 days after admission. Overall, the risk of suicide-related events appears to be greatest during the period shortly following admission, but the risk remains during extended admissions.
In our study, nearly all (96%) of the suicide-related events occurred in private areas of the inpatient units, as opposed to common areas (4%), which was also reported by other studies.10,20,29 Within our sample, the occurrence of events was similarly distributed across the bedroom (47%) and bathroom (43%) areas, while very few occurred at the staff’s station, day room, or hallway. The bedroom and bathroom were frequently reported locations in other studies, each associated with a high percentage of events, and all these studies reported that a higher percentage of events occurred in the bedroom than the bathroom.10,19,20,29
As reported in prior studies3,8,10,16,20,21,28,29 and our study, neck compression (i.e., hanging and strangulation) was the method most frequently associated with both attempted suicides and suicides. Aligned with our study, other studies10,16,21,28,29 also reported patients’ use of cutting, substance consumption (e.g., illicit drugs), blunt impact (e.g., jumping), suffocation, and stabbing, but each was much less frequent than neck compression.
In our study, almost all suicide-related events involved an object, which varied by type of method. Ligature, an object used during neck compression, was either clothing or bedding in 84% of the suicide-related events in our study. This finding is consistent with prior research of the psychiatric inpatient populations.17,29 Other studies,10,17,29 relative to the present study, frequently reported the following types of ligature: belts, cords, bags, curtains, and coat hangers. It is unclear why, but the difference between the types of ligature reported by our study and other studies could be attributed to their use of non-U.S. patient populations and/or older data sets, which may reflect different regulations, policies, practices, resources, and cultures.
The types of ligature points identified in our study were also frequently reported in prior studies.10,29 Collectively, across our study and prior studies, bedroom and bathroom doors were the objects most frequently used as ligature points.17,20,29 Unlike our study, other studies frequently reported the following ligature points: door hardware, cabinets, lockers, hooks, ceiling vents, and grab bars.10,17,20,29 The differences in types of ligature points reported across studies could be related to their use of non-U.S. patient populations and/or older data sets.
Finally, our results were consistent with another study10 that analyzed the distribution of neck compression events with and without a ligature point. Our study and the prior study both found that a minority of neck compression attempted suicides involved a ligature point (23% in our study and 41% in the other study). Our study provided further insight into this topic by revealing that 70% of neck compression events that involved a ligature point resulted in a completed suicide. This finding highlights the potential severity of risk associated with availability and use of ligature points within inpatient psychiatric units.
The cutting events included in our study frequently involved glass and metal materials, but less common was wood. This finding is similar to previous research,29 which also identified the following specific objects that differed from our study: plastic knife, aluminum can, sharp rock, scissors, comb, plastic name plate, sewing needle, and toilet paper holder spring. The collective findings suggest that patients use items that are common within facilities (e.g., light bulb, pencil, eyeglasses) or miscellaneous items that were likely unintended to be present and found by the patients (e.g., scissors, sewing needle, razor blade).
Limitations and Future Directions
Due to sparse detail or erroneous event classification, some suicide-related events may have been excluded from our query, thereby reducing our sample size. Our sample size of 143 reports may limit the statistical power to detect differences across multiple categories or to support extensive post hoc comparisons; nevertheless, the clinical and public health significance of the topic warrants presentation of the findings. Accordingly, we report statistically significant results where appropriate and apply cautious interpretation, including hedging, in cases where patterns emerge but do not meet conventional thresholds for significance. Finally, deeper interpretation of suicide-related events was constrained due to many reports lacking the necessary detail to support analysis of underlying causes and associated factors (e.g., patients’ diagnoses according to the American Psychiatric Association’s Diagnostic and Statistical Manual of Mental Disorders, Fifth Edition [DSM-5] criteria, history of attempted suicide).
More studies are needed with U.S.-based psychiatric inpatient populations. In particular, research is needed to explore the possible explanations for associations between suicide-related events and event month, day of week, time of day, days after admission, and availability of ligature points during neck compression. This could be achieved by interviewing staff at inpatient psychiatric units to gain insight into the relationship among these variables. This information would complement the findings from this study and could guide development of interventions at inpatient psychiatric units.
Conclusion
This retrospective mixed-methods analysis of 143 PA-PSRS serious event reports provides insight into the circumstances of suicide-related events occurring within inpatient psychiatric units at U.S.-based facilities. The data reveals distinct patterns of suicide-related events across demographic, method, object involved, location, and temporal variables. For example, a significantly greater frequency of events occurred during October–March and during the evening shift (15:00–22:59). Additionally, significantly more suicides occurred during neck compression with use of a ligature point, as opposed to without a ligature point. The results highlight priority areas for additional inquiry (including qualitative investigation) and offer empirical evidence to inform stakeholders and policy discussions aimed at reducing suicide-related events within inpatient psychiatric settings.
Notes
This analysis was exempted from review by the Advarra Institutional Review Board.
Data used in this study cannot be made public due to their confidential nature, as outlined in the Medical Care Availability and Reduction of Error (MCARE) Act (Pennsylvania Act 13 of 2002).22
Artificial intelligence (Microsoft’s Copilot) was used only to improve sentence clarity. No AI was used for data analysis, interpretation, or generation of original content. The authors take full responsibility for the accuracy and integrity of the manuscript.
Disclosure
The authors declare that they have no relevant or material financial interests.
About the Authors
Matthew A. Taylor (MattTaylor@pa.gov) is a research scientist on the Data Science & Research team at the Patient Safety Authority, where he conducts research, uses data to identify patient safety concerns and trends, and develops solutions to prevent recurrence.
Shawn Kepner (shawkepner@pa.gov) is a data scientist at the Patient Safety Authority (PSA). He is responsible for providing actionable insights using data science techniques and works with staff to focus resources and research in areas that have the greatest benefit to patient safety. He also serves as the data editor for Patient Safety, PSA’s award-winning, peer-reviewed journal.